Do you know how many people there are in the world? There are 8.2 billion people globally. Of these, 5.56 billion are Internet users and 5.24 billion actively use social media. India’s internet usage has grown rapidly, making it the second-largest online market after China. There are 971.50 million internet users in India, equivalent to 67.03% of the country’s population. Additionally, the country has about 927.86 million wireless and 43.64 million wired internet subscribers.
These figures not only show the massive online presence of the Indian audience but also the potential in the country as it has nearly 33% of the population yet to get online.
In this blog, we will explore India’s internet user demographics through numbers acquired from official sources.
Internet Users Statistics in India 2025 (Editor’s Picks)
- There are 971.50 million internet users in India as of 2025.
- The internet penetration rate in the country is 67.03%.
- The total data on the internet is estimated roughly 182 zettabytes.
- There are around 270 million 5G users in India.
- India is in the 25th position in the OOKLA Speedtest Global Index.
How long has the Internet been around?
The Internet was invented on January 1, 1983, because it marked the adoption of the TCP/IP protocol. However, the concept of a global network of computers started in the 1960s with ARPANET, a project funded by the United States Department of Defense.
Since then, the Internet has evolved significantly. In 1989, the World Wide Web (WWW) was developed and invented by a British scientist, Tim Berners-Lee, and it was opened to the general public in 1993.
To sum up the question, the Internet has been around for over 60 years.
How big is the internet?
The Internet is growing every second, making it difficult to calculate the exact size. As the Internet keeps on growing these facts will also change. Here are some key facts to give you an idea of how big the Internet is:
- There are over 1.11 billion websites globally, but only 200 million are active, accounting for only 17% of the total.
- Have you ever wondered, how much data is on the Internet? The total data on the internet is estimated to be around 182 zettabytes in 2025 and is projected to cross 394 zettabytes by the end of 2028. Upon calculation, we can say the total internet data is around 1.82e+11 TB.
- According to some reports, Google has indexed over 400 billion web pages and crawled more than a trillion by 2025.
How many people use the Internet?
In 2025, 5.56 billion of the 8.2 billion people worldwide are using the Internet. This means 67.8% of the world’s population is on the Internet. Whereas, 971.50 million Indians use the Internet, ranking second after China in the countries with the most Internet users list. China has over 1.09 billion Internet users comprising 78% of its population.
Internet Penetration Rate in India
The internet penetration rate in India has surpassed all expectations. Till 2022, India was last in 5G coverage but as of 2025, it is among the top countries with the highest number of 5G subscribers. Here are a variety of interesting statistics data you should know:
- As of January 2025, roughly 67.03% of India’s population uses the Internet. This is a 3.77% increase from the previous year.
- Internet users in India are expected to surpass the 1 billion mark by the end of 2025.
- Around 270 million 5G users were there in India, a staggering 106.11% increase from 131 million in 2023.
- The most popular activities on the Internet in India are social media, online shopping, and watching videos.
- The average smartphone price in India is around $294 or roughly ₹25,000, an 8% increase from the previous year. The average smartphone price worldwide is $349.
- India has over 1.153 billion cellular mobile connections, a 1.44% dip from the second quarter.
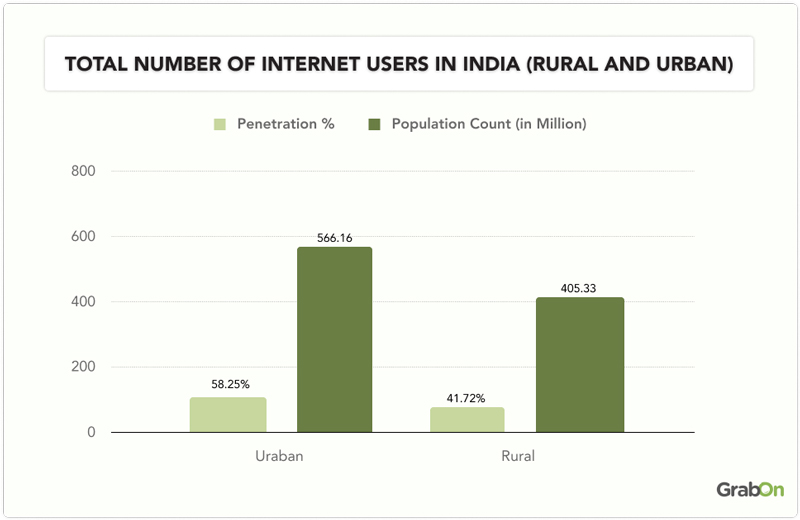
Internet Penetration Rate in Rural and Urban India
7 out of 10 Indians have internet access, with 58.25% accessing from urban areas and around 40% from rural regions. The user count for urban areas stands at 566.16 million, while for rural areas, it is 405.33 million.
According to TRAI, about 95% of villages in India have 3G/4G connectivity.
Here is the table to showcase the internet penetration rate in India by location:
| Location | Urban areas | Rural areas |
| Penetration % | 58.25 | 41.72 |
| Population Count
(in Million) |
566.16 | 405.33 |
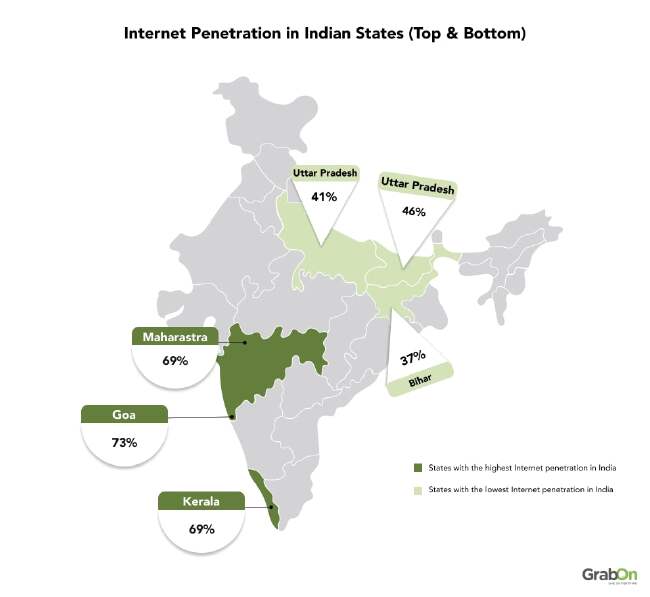
Internet Penetration Rate in India State-wise
Internet usage across different states has increased significantly in recent years. Around 70% of the population of Goa, Maharashtra, and Kerala use the internet, the highest in the country. Whereas, only 4 out of 10 people in Bihar use the internet, the lowest in the country.
Internet penetration in a state affects its overall literacy rate and development. Here are the states in India with the highest and lowest Internet penetration rates.
States with the highest Internet penetration in India
| States | Number of Users (in %) |
| Goa | 73% |
| Maharastra | 69% |
| Kerala | 69% |
States with the lowest Internet penetration in India
| States | Number of Users (in %) |
| Bihar | 37% |
| Uttar Pradesh | 41% |
| Jharkhand | 46% |
Source: Kantar, IAMAI, DataReportal, TRAI, Ericsson, Statista, IBEF
Demographic Breakdown of Internet Users in India
India’s internet penetration has grown exponentially in recent years. A major reason for this growth is due to cheap data costs. In this section, we will cover the internet penetration rate in the country by location, state, gender, and age. This data shows that over half of the country’s population uses the Internet. Check out the below-listed stats data to learn more about Indian internet users’ demographic:
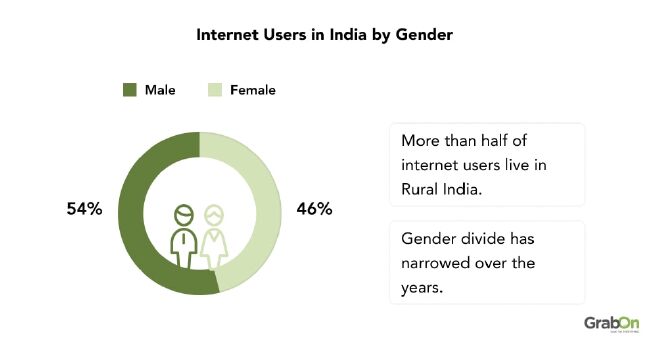
Internet Users in India by Gender
54% of the Indian internet users are male, compared to 46% of females. The gender gap in internet access in India is narrowing. In 2023, women made up 31% of internet users, this number has increased to 46% in current times.
The table below shows the recent internet user statistics in India by gender:
| Gender-Specific Internet Users | Male | Female |
| 54% | 46% |
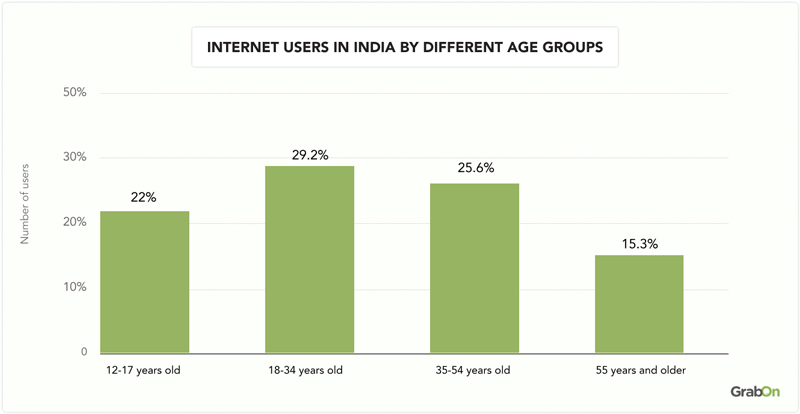
Internet Users in India by Age Group
3 out of 10 Indian internet users belong to the 18 to 34 age group, the highest among other age groups. Following them are users from 35 to 54 age with 25.6% using the internet. Users aged 12 to 17 rank third in the list, with 22% using the internet, while those over 55 years are last, with 15.3%.
The below list showcases the Indian internet users by age group:
| Age group | Percentage of Internet users |
| 12-17 years old | 22% |
| 18-34 years old | 29.2% |
| 35-54 years old | 25.6% |
| 55 years and older | 15.3% |
Sources: Kantar, Statista, DataReportal
How is India using the Internet?
Internet usage has surged exponentially in recent years thanks to the digital revolution by JIO in 2016. Before 2016, the per-month data consumption of an average Indian was around 2.8 GB, whereas in 2025, it has crossed 24.1 GB. This boost in data consumption has increased traffic in various categories, platforms, and more. Below, we have compiled various Internet usage statistics for you to check:
Internet Usage Statistics in India By Category
Studies revealed that around 92.7% of Indian internet users use the internet to watch videos or movies. If we break down the statistics further, we see that most video watchers prefer to watch “How To” guides and “educational” videos. Following this, 91.7% and 85% of online users use the internet to play online games and use search engines, respectively.
Interestingly, with the introduction of AI chatbots, numerous Internet users in India started using platforms, like Google Gemini, ChatGPT, etc. However, their usage percentage is lower compared to other activities. According to various ChatGPT statistics data, India is second in web traffic by country list and the same goes for Google Gemini.
Here is a table showing how Indians are using the Internet:
| Internet Users Watching Videos/Movies | 92.7% |
| Internet Users Playing Online Games | 91.7% |
| Internet Users Using Search Engine | 85% |
| Internet Users Shopping Online Weekly | 59.3% |
| Internet Users Using Social Media Platforms | 61.5% |
| Internet Users Listening to Music | 61.3% |
| Internet Users Watching Educational Videos | 40.2% |
| Internet Users Using Online Translators | 30.8% |
| Internet Users Watching How-to-do Videos/Tutorials | 26.2% |
| Internet Users Using Voice Assistant | 25.7% |
| Internet Users Using Banking/Insurance/Investment Apps/Websites | 23.9% |
| Internet Users Using “Buy Now, Pay Later” Services | 16.6% |
Internet Usage Statistics in India by Devices and Platforms
- In 2010, there were only 545.05 million wireless users in India. As of 2025, the number of wireless internet users in India has grown to 1.14 billion. This represents a growth of over 200% in just 15 years!
- In India, 96.6% of internet users access the internet via mobile devices, including 94.7% using smartphones, 4.7% using feature phones, and 16.5% using tablets
| Users accessing the internet via mobile devices | Users accessing the internet via smartphones | Users accessing the internet via feature phones | Users accessing the internet via tablets |
| 96.6% | 94.7% | 4.7% | 16.5% |
- Smartphones accounted for 78.62% of India’s internet traffic, laptops/desktops for 20.95%, and tablets for 0.43%.
- On average, around 9 out of 10 Indian internet users spend about 1 hour and 30 minutes online daily, mainly on social media. Among these platforms, Instagram has become extremely popular in India, largely because of its feature called “Reels.” Various Instagram statistics data indicate that the platform has approximately 362.9 million users nationwide.
How much time do Indians spend on the Internet?
Around 96% of Indians use the Internet via their smartphone, compared to 48.1% on laptops or desktops. 18.8% of users consume online content through tablets.
According to the latest data, Indians spend an average of 6 hours 49 minutes daily using the Internet. Out of which, smartphone users spend around 3 hours 57 minutes, compared to 2 hours 52 minutes for desktop or tablet users.
Reports also suggested that people use social media platforms for 2 hours and 28 minutes, music streaming for 1 hour and 49 minutes, and online gaming for 1 hour and 31 minutes.
Here is the table to showcase the time spent by Indians on the Internet:
| Category | Time Spent on the Internet |
| Internet | 6 hours 49 minutes |
| Internet (Mobile Phones) | 3 hours 57 minutes |
| Internet (Laptop, Desktop, or Tablet) | 2 hours 52 minutes |
| Social Media | 2 hours 28 minutes |
| Music Streaming | 1 hour 49 minutes |
| TV (Streaming and Online) | 1 hour 43 minutes |
| TV (Linear or Broadcast) | 1 hour 41 minutes |
| Game Consoles | 1 hour 31 minutes |
| Podcasts | 1 hour 19 minutes |
| Press (Online) | 1 hour 15 minutes |
Source: Datareportal
Internet Usage Statistics in India by Different Patterns
Indians use the internet for gaming, shopping, video streaming, and sports viewing. Google publishes its “The Year in Search” report every year to display the top searches by users in different fields, like movies, shows, sports, and matches. Explore the statistics below stats figures to learn more about the internet usage patterns of Indians.
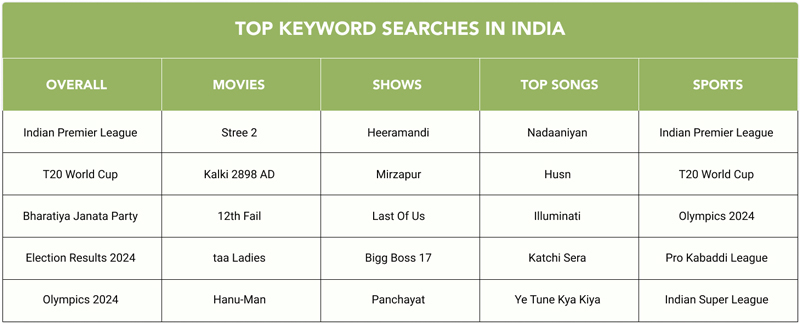
1. Top Keyword Searches in India
Google’s ‘The Year in Search: India’ report highlights how much time Indians spent searching various topics online. Popular searches included the Indian Premier League, T20 World Cup, General Election 2024, Olympics 2024, Ratan Tata, and more. Here are some of the top keyword searches in India:
2. Online Services
- Searches for “buy mutual funds” increased by 15.68% from 2024 to 2025.
- India has roughly 491 million online gamers, with 25% paying gamers.
- 4 out of 10 rural and semi-urban internet users use UPI for online payments and transactions.
- 9 out of 10 internet users in India use Google Chrome as their primary browser, followed by Safari and Microsoft Edge with 4.95% and 2.55%, respectively.
- Around 20% of internet users in India own cryptocurrency.
- Internet users accessing digital treatment and care services increased by 13.1%.
Internet Usage and Regional Variations
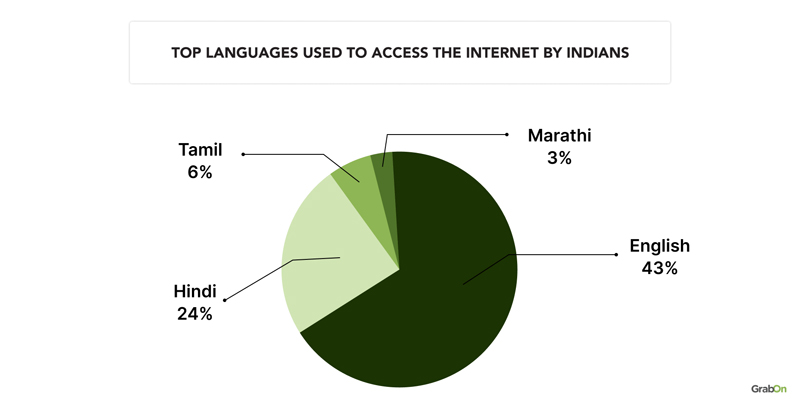
Only 4 out of 10 Indians access the internet in English, followed by 24% in Hindi and 6% in Tamil. Languages like Tamil, Telugu, and Malayalam show high and mid-conversion ratios. However, Gujarati, Marathi, and Bengali fall into low conversion ratios.
Indic language users primarily access the internet to watch videos, listen to music, communicate, use social media, shop online, and conduct searches. These activities are listed in descending order based on their percentage of engagement.
Language-Specific Internet Users in Urban India
| Language used to access the Internet | Users in Percentage |
| English | 43% |
| Hindi | 24% |
| Tamil | 6% |
| Marathi | 3% |
Sources: Techmagnate, Statista, Kantar, DataReportal, Google Trends, Similarweb
India’s Mobile Connectivity Statistics 2025
Do you know how many Indians have smartphones? There are 1.1 billion smartphone users in India as of 2025, a 5.56% increase from last year. It is projected that smartphone users in the country will cross 1.5 billion by the end of 2030.
Since the launch of 5G in India, we have witnessed significant download and upload speed growth by roughly 100%. Leading telecom companies like JIO and Airtel, have installed 5G towers in over 10,000 cities, placing India at the top in 5G deployment speed. Here are some of the top India’s mobile connectivity statistics to know:
1. Global Ranking Improvement
- India ranks 25th in Speedtest’s mobile rankings, improving from 47th in 2023 to January 2025.
- Median download speeds have doubled, increasing from 50.21 Mbps in 2023 to 100.78 Mbps as of January 2025.
2. Improved Mobile Performance Across Telecom Circles
- JIO has the highest average 4G download speed at 89.5 Mbps, followed by Airtel at 44.2 Mbps. For 5G, JIO offers 224.8 Mbps, while Airtel delivers a faster 239.7 Mbps.
- 5G download speeds vary significantly depending on regions. In the Northeast, speeds average 201.3 Mbps, while in Tamil Nadu, they reach up to 269.1 Mbps.
State of 5G Worldwide 2022 vs 2025
2022
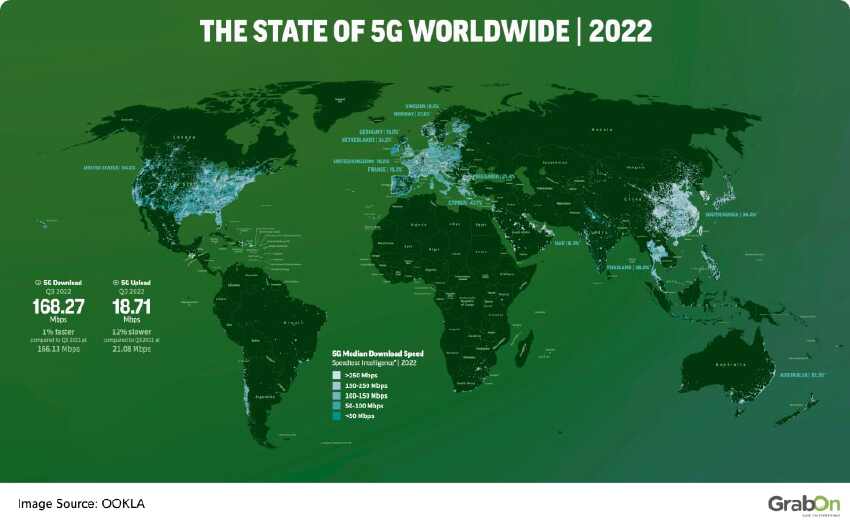
2025
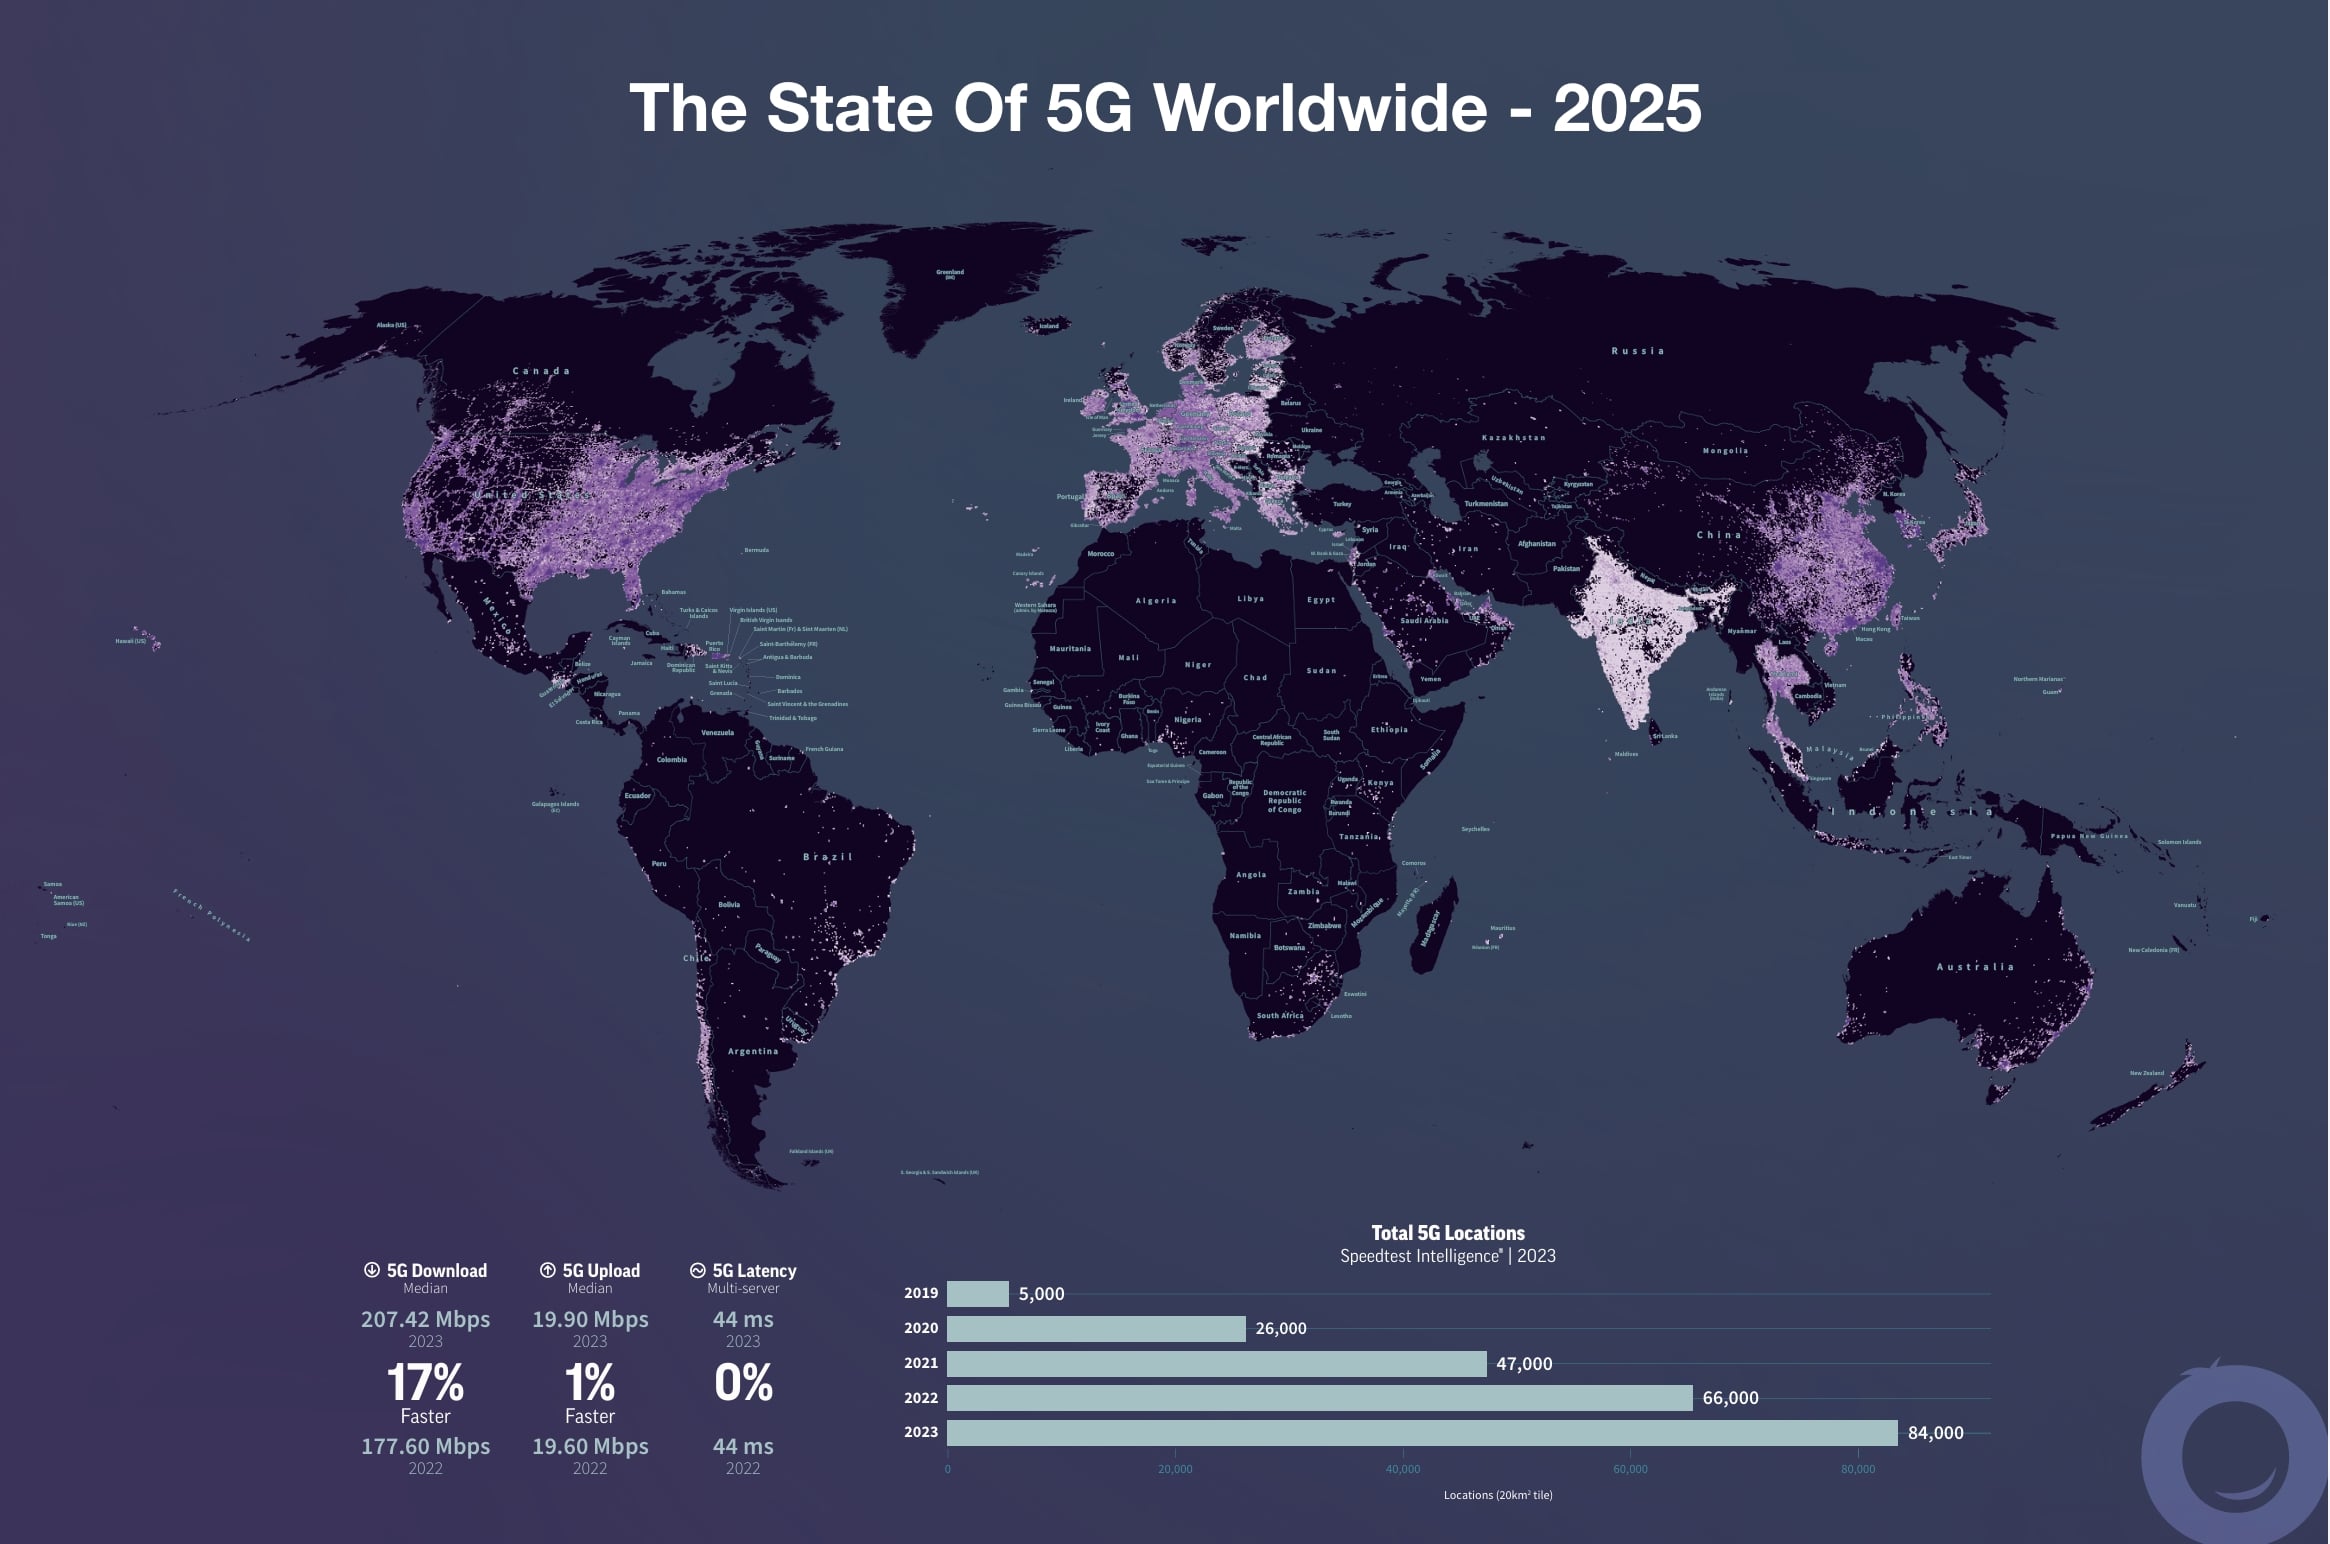
3. Leadership in 5G Speed and Adoption
- Jio and Airtel launched 5G technology in October 2022, expanding nationwide coverage.
- Initial median 5G download speeds in India were under 100 Mbps but later surged to 690.6 Mbps across all areas.
- The 5G download speed in the country is 18 times faster than 4G networks.
- 5G availability in India is 24.4% for Airtel and 66.7% for Jio.
- Jio had surpassed 148 million 5G customers, while Airtel reached over 120 million.
- An average 5G user in India consumes 3.6x more data than a 4G user.
- India has over 4.6 lakh 5G base stations, up from 53,590 in January 2023.
4. Remarkable 5G Speeds
Improved Video Start Times:
- JIO’s 5G network has a video start time of 1.14 seconds, while Airtel’s is 1.29 seconds.
- JIO’s 4G LTE network has a video start time of 1.99 seconds, while Airtel’s was slightly faster at 1.73 seconds.
Enhanced Gaming Experience:
- JIO’s median latency is 77 milliseconds, compared to Airtel’s 92 milliseconds.
Sources: OOKLA, Opensignal, OOKLA – India 5G Report, TRAI, NOKIA, DOT – Ministry of Communications, Statista
Social Media Usage Statistics in India
Have you ever wondered, how many social media users in India? Reports suggest that India has over 462 million social media users as of 2025, around 31.70% of the total population.
Interestingly, 7 out of 10 social media users in India are males, while only 31.4% are female. However, it’s important to note that social media users may not represent unique individuals, as some could maintain multiple accounts.
Internet users in India now spend an average of 2 hours and 26 minutes online daily, marking a reduction of 23 minutes compared to previous trends.
According to various statistics of YouTube users in India, Google Ads reports that roughly 476 million users use the platform.
Top Social Media Platforms in India
| Platform | Traffic Share (in %) |
| 64.03% | |
| 25.61% | |
| YouTube | 6.07% |
| X (Twitter) | 1.75% |
| 1.69% |
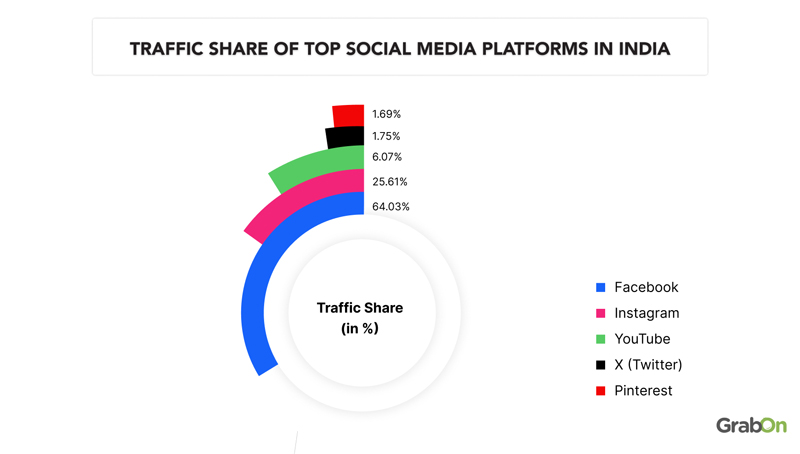
Source: SimilarWeb, DataReportall, Statista
E-Commerce Platforms Usage Statistics in India
As of 2025, India has around 270 million e-commerce platform users, which is expected to cross 375 million by the end of 2030. The country’s e-commerce penetration rate is roughly 18.9%, with Amazon dominating the market with 407.7 million monthly visits, followed by Flipkart with 203.3 million and Myntra with 48.8 million monthly visits.
Top E-Commerce Platforms in India
| Platform | Monthly Visits in Millions |
| Amazon India | 407.7 million |
| Flipkart | 203.3 million |
| Myntra | 48.6 million |
| Indiamart | 42.4 million |
| Meesho | 35.7 million |
How Are Small Businesses in India Harnessing the Power of the Internet?
Reports suggest that online businesses in India are projected to cross $1 trillion by 2030. The country’s online retail market is growing rapidly, estimated to reach $325 billion by 2030.
According to the GoDaddy Data Observatory India report, over half of small businesses in India were started in the last 5 years. Of these, 6 out of 10 small businesses have a website, online store, or eCommerce platform to grow their business.
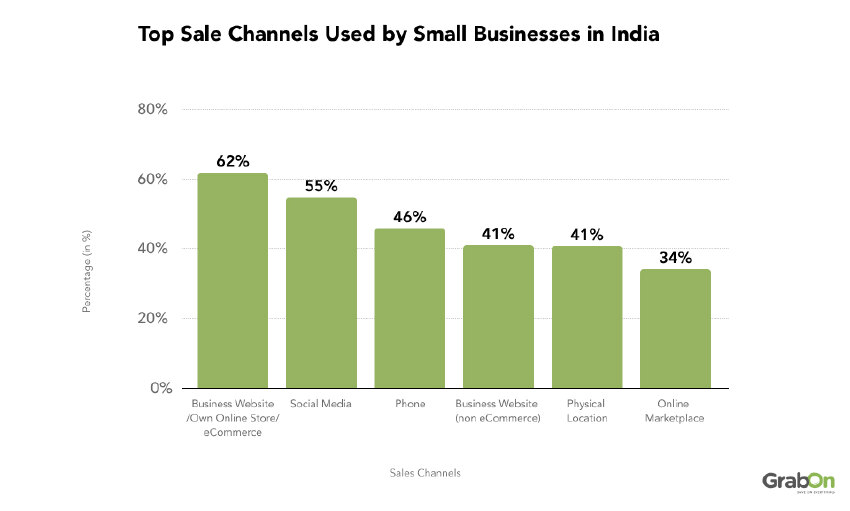
Different Sales Channels Used by Small Businesses
| Sales Channels | Percentage (in %) |
| Business Website/Own Online Store/eCommerce | 62% |
| Social Media | 55% |
| Phone | 46% |
| Business Website (non eCommerce) | 41% |
| Physical Location | 41% |
| Online Marketplace | 34% |
Sources: Temasek, Bain & Company, Statista, DataReportal, Deloitte, GoDaddy, Bain & Company, Semrush, IBEF
Digital India Statistics 2025
“Digital India” is an initiative launched by the Government of India on July 1, 2015, by Prime Minister Narendra Modi to transform the country into a digitally empowered society and knowledge economy.
Its primary goal is to ensure that government services are made available to citizens electronically by improving online infrastructure and increasing Internet connectivity across the country.
The initiative aims to achieve key objectives, including the development of digital infrastructure and digital literacy, making governance more efficient, transparent, and accessible, promoting digital empowerment, boosting the electronics manufacturing industry, and strengthening cybersecurity measures.
- As of 2025, India has over 1.15 billion wireless subscribers, up from 952 million in 2015.
- The number of smartphone users in India has also increased significantly. Over 1.14 billion people own a smartphone; this number is expected to reach 1.5 billion by 2026.
- The Government of India introduced The Digital India Act 2023 to build a secure and inclusive online environment focusing on empowering citizens. The act enhances digital infrastructure, promotes literacy, and bridges rural-urban digital disparities.
- The government has launched several initiatives to promote digital literacy in India, including the Pradhan Mantri Gramin Digital Saksharta Abhiyan (PMGDISHA). This program has successfully trained over 48 million individuals in digital literacy. As part of this initiative, a total of 430,000 training centers have been established across the country.
- The Unified Payments Interface (UPI) is India’s leading digital payment platform, with over 16,730.01 million transactions (by volume) worth Rs 23.24 lakh crore facilitated till January 2025.
Sources: TRAI, I&B Ministry, PMGDISHA, NPCI
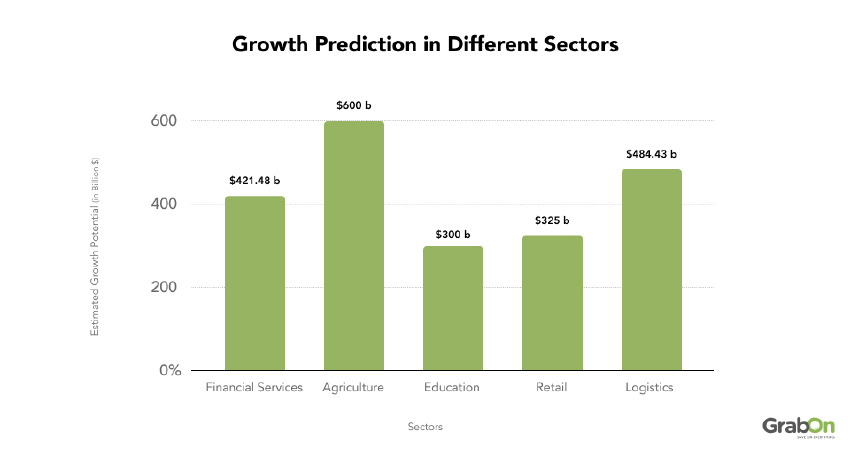
Digital India: Predicted Transformation of India’s Economy by 2030
The Digital India program, initiated by the Central Government, has significantly enhanced several sectors, fostering heightened business activities nationwide. It has streamlined the process of starting new businesses and has made conducting business operations easier. Many think tanks have predicted tremendous growth in multiple sectors in India by 2030.
| Sectors | Estimated Growth Potential |
| Financial Services | $421.48 billion |
| Agriculture | $600 billion |
| Education | $300 billion |
| Retail | $325 billion |
| Logistics | $484.43 billion |
Sources: Deloitte, MEA, Mordor Intelligence, McKinsey & Company
Global Internet Users Statistics 2025
The world population as of 2025 is over 8.2 billion, of which 5.5 billion people use the internet. This means over 66% of the global population is now connected to the Internet. Upon calculating, we found that the worldwide internet population has grown by 1.8% in the last 12 months.
Internet Usage Statistics by Country
94.7% of internet users globally use the internet to visit chatting and messaging apps/websites followed by using social networking platforms and search engine sites/apps, with 94.3% and 80.7%, respectively.
7 out of 10 users worldwide use the internet for online shopping and participate in auctions. Whereas, only 54.4% of users access the internet to view maps and parking areas, and access location-based services.
The table below will show the top 5 websites/apps that Internet users visit per month globally.
| Websites Visited | % of Internet Users |
| Chat and Messaging | 94.7% |
| Social Network | 94.3% |
| Search Engines | 80.7% |
| Shopping and Auctions | 74.3% |
| Maps, Parking, or Location-based services | 54.4% |
Internet Penetration Rate by Country
The global average internet adoption rate is 66.2% and the Netherlands dominates all countries in this category with a 99% adoption rate. It is followed by Switzerland and Norway with 99% and 99%, respectively.
In contrast to the penetration rate, China leads in the list of internet users by country, with 1.09 billion, followed by India with 971.50 million. The United States and Brazil are in the third and fourth positions with 331.1 million and 187.9 million users, respectively.
Here is the table of the top 10 countries with the highest internet adoption rate in the world.
| Country | Internet Adoption Rate |
| Netherlands | 99% |
| Switzerland | 99% |
| Norway | 99% |
| Saudi Arabia | 99% |
| Ireland | 99% |
| U.A.E | 99% |
| Denmark | 99% |
| Sweden | 98.1% |
| U.K | 97.8% |
| Malaysia | 97.4% |
Source: DataReportal
Wrapping Up
The data we discussed indicates that India has made significant progress in internet penetration in recent years. For the first time in the country’s history, rural areas have surpassed urban locations in terms of the number of internet users. With the fastest deployment of 5G and the early development of 6G, the Government of India ensures that our country stands out among developed nations in adopting the latest technologies. However, various challenges must be addressed promptly to ensure that the Internet reaches every citizen in India, making our country truly digital.
FAQs
What is the average Internet usage in India in 2025?
India has over 971.50 million Internet users as of 2025 and an average person uses over 25 GB per month. This has positively influenced the daily usage patterns and time spent by Indians. According to the latest reports, 4G data traffic contributed over 95% of the overall data traffic in the country.
How many people in India have no access to the Internet in 2025?
As of 2025, over 971.50 million Indians have access to the Internet, while around 600 million users don’t have access to the Internet. With 5G launched in the country, more people will use the Internet in the future.
What is the rank of India in Internet usage in 2025?
India ranks second after China in the Internet usage list as of 2025 with over 971.50 million of its population accessing the Internet. It is expected that the country will cross the 1 billion mark in Internet users by the end of 2025.
Which city in India has the best Internet in 2025?
Recent reports indicate that Delhi has the fastest internet speed among all major cities in India, with an average download speed of 77.2 Mbps and an upload speed of 54.7 Mbps. Following closely is Hyderabad, which has an average download speed of 71.5 Mbps and an upload speed of 53.6 Mbps.
What is the digital literacy rate in India?
According to CBWE, around 4 out of 10 Indian households are digitally literate. Urban areas dominate in digital literacy with 61% of people being digitally literate than 25% in rural areas.
Which country has the cheapest Internet in 2025?
As of 2025, Israel offers the lowest cost for Internet access, with a price of just $0.02 per GB. Fiji and Italy follow, ranking second and third, with the cost per GB at $0.09 each. India ranks seventh on the list, where an average person pays $0.16 per GB.