In 1992, the world was introduced to the first smartphone, a device that would redefine communication and personal technology. Fast forward to 2025, and we find ourselves in an era where 4.88 billion people are connected through smartphones, representing 60.42% of the global population.
Today, smartphones are not just communication devices; they are central to our daily lives, with the average person spending 4 hours and 37 minutes on their phone each day. At the time of writing this post, there are 7.21 billion smartphones in the world, set to exceed the world population shortly.
Explore the most smartphone statistics that highlight their profound impact on global connectivity and daily routines.
Smartphone Statistics & Trends 2025 (Top Picks)
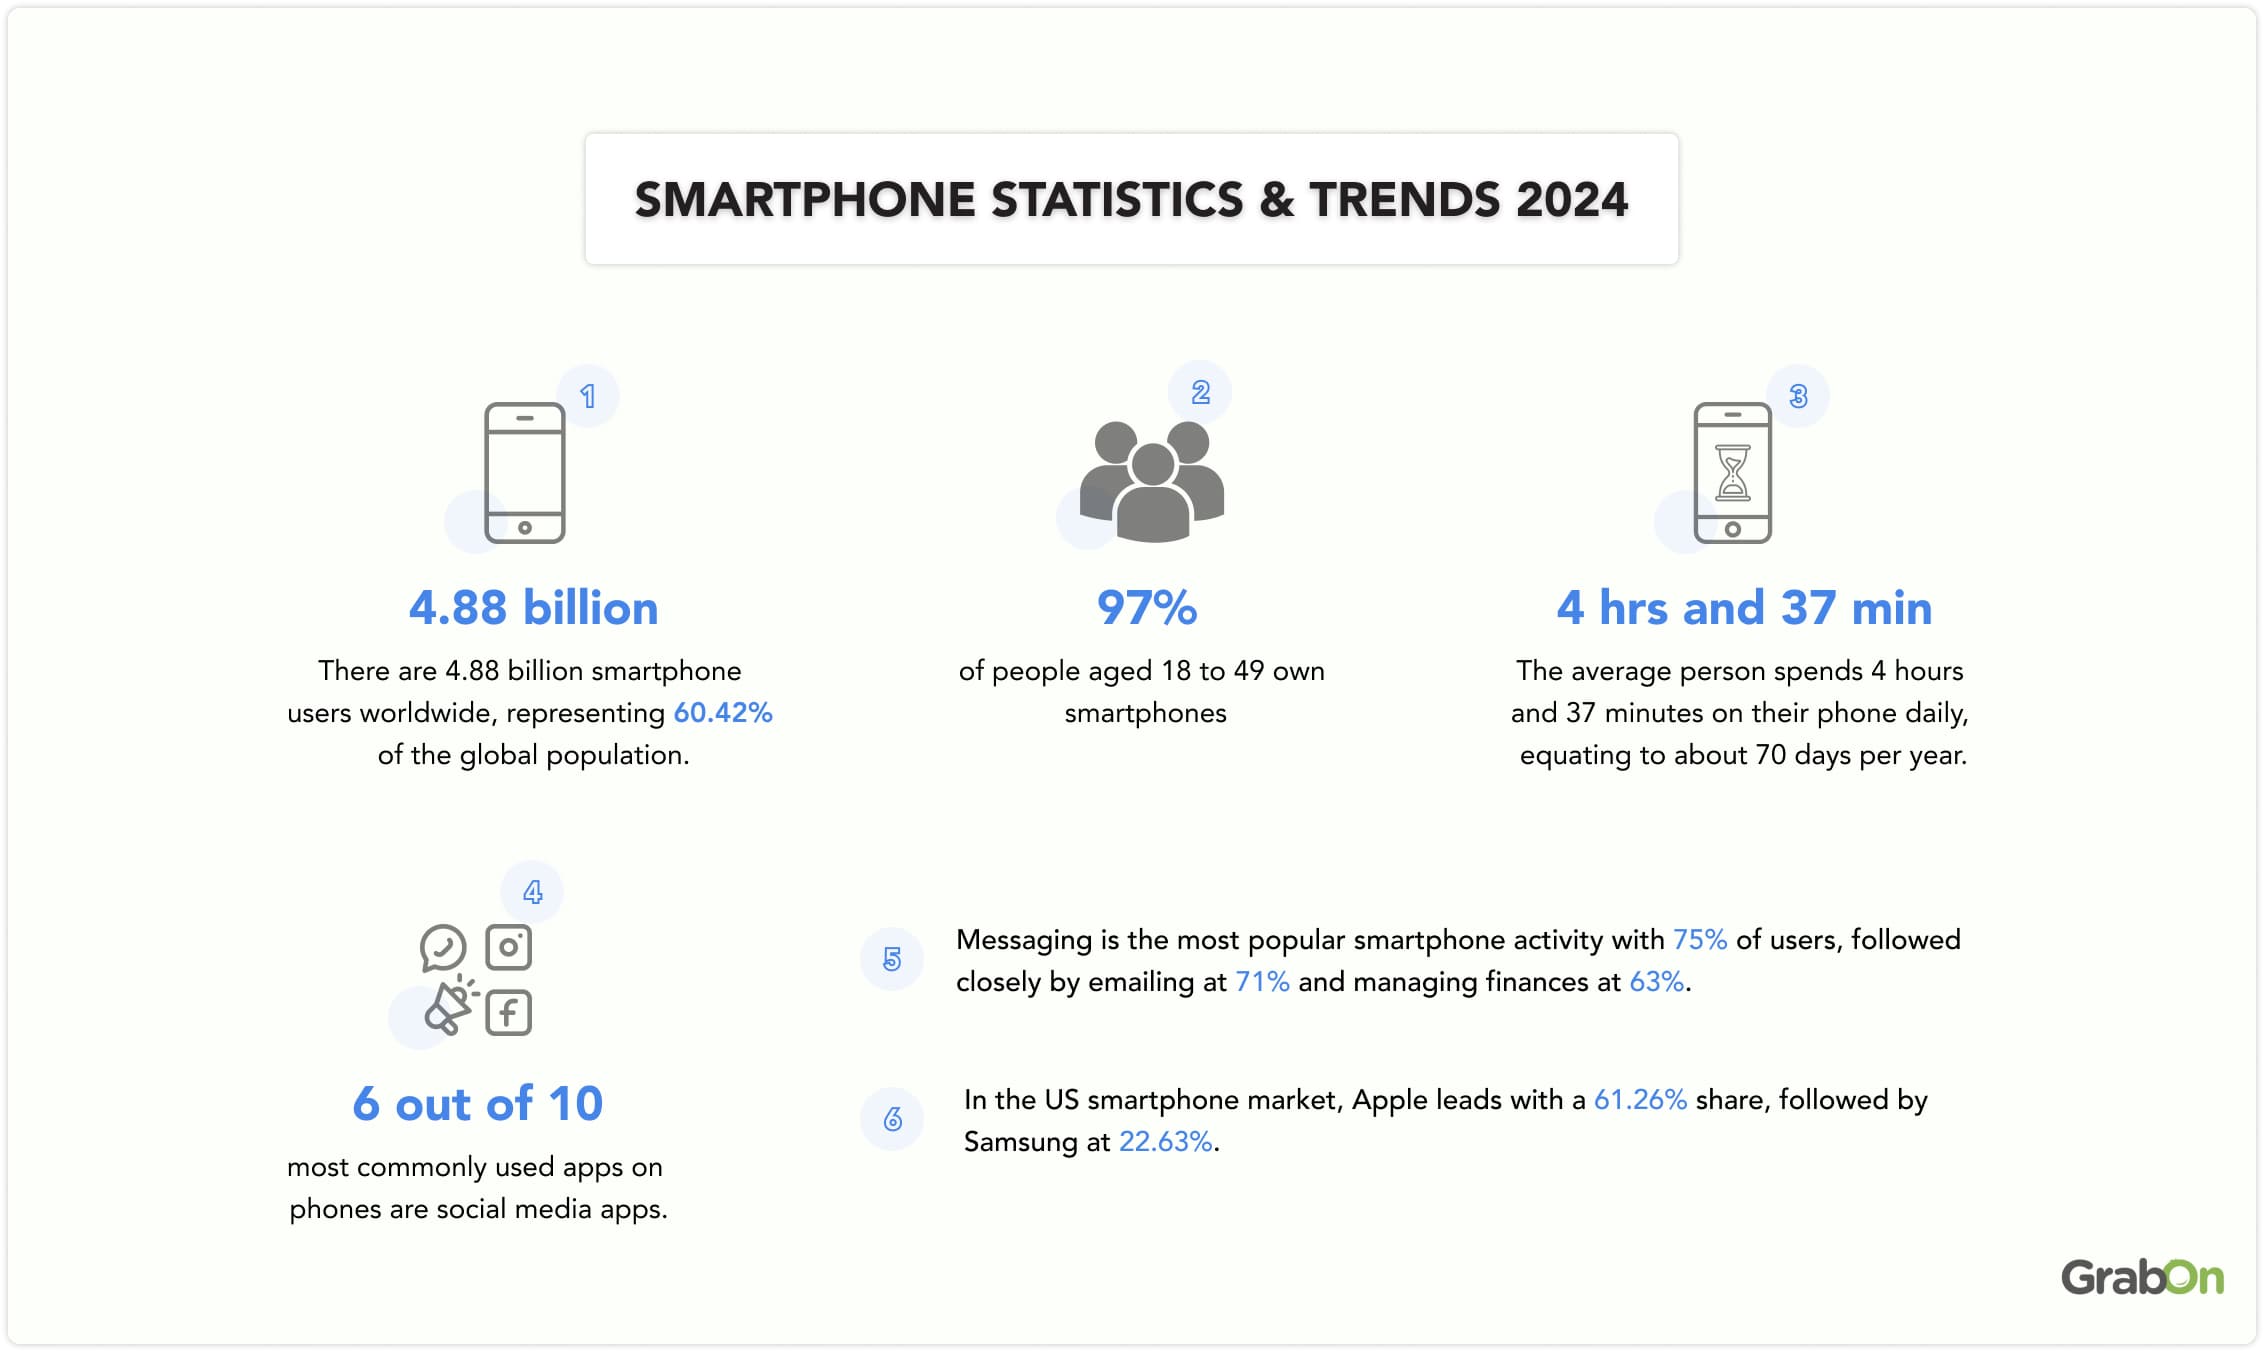
1. There are 4.88 billion smartphone users worldwide, representing 60.42% of the global population.
2. 97% of people aged 18 to 49 own smartphones.
3. The average person spends 4 hours and 37 minutes on their phone daily, equating to about 70 days per year.
4. 6 out of 10 most commonly used apps on phones are social media apps.
5. Messaging is the most popular smartphone activity with 75% of users, followed closely by emailing at 71% and managing finances at 63%.
6. In the US smartphone market, Apple leads with a 61.26% share, followed by Samsung at 22.63%.
How Many People Own Smartphones?
4.88 billion people worldwide own smartphones, accounting for 60.62% of the global population. From 2019 to date, there has been a 114.97% increase in the number of people with a smartphone.
The number of smartphone users worldwide is expected to grow by 1.5 billion, a 30.6% increase by 2029, and the total number of smartphone users is projected to reach 6.4 billion, setting a new record.
The table below highlights the number of smartphone users worldwide and their year-over-year growth:
| Year | Number of smartphone users (in billions) | YOY Growth |
| 2029* | 6.38 | 2.5% |
| 2028* | 6.22 | 3.5% |
| 2027* | 6.01 | 6.3% |
| 2026* | 5.65 | 7.2% |
| 2025 | 5.28 | 8.0% |
| 2024 | 4.88 | 14.9% |
| 2023 | 4.25 | 17.4% |
| 2022 | 3.62 | 16.8% |
| 2021 | 3.10 | 16.1% |
| 2020 | 2.67 | 17.7% |
| 2019 | 2.27 | 16.7% |
Source: Bankmycell
How Many Smartphones Are In The World?
There are 7.21 billion active smartphones in the world, with many individuals owning multiple smartphones. When including feature phones, the total number of active mobile subscriptions rises to 8.31 billion, with 1.1 billion of these being feature phones.
The table below shows the number of smartphones in the world:
| Year | Number of Smartphones (in billions) |
| 2029* | 8.06 billion |
| 2028* | 7.95 billion |
| 2027* | 7.77 billion |
| 2026* | 7.58 billion |
| 2025 | 7.43 billion |
| 2024 | 7.21 billion |
| 2023 | 6.97 billion |
| 2022 | 6.62 billion |
| 2021 | 6.34 billion |
| 2020 | 5.92 billion |
| 2019 | 5.59 billion |
| 2018 | 5.05 billion |
| 2017 | 4.45 billion |
| 2016 | 3.70 billion |
| 2015 | 3.00 billion |
| 2014 | 2.33 billion |
Source: BankMyCell
Smartphone Users By Country
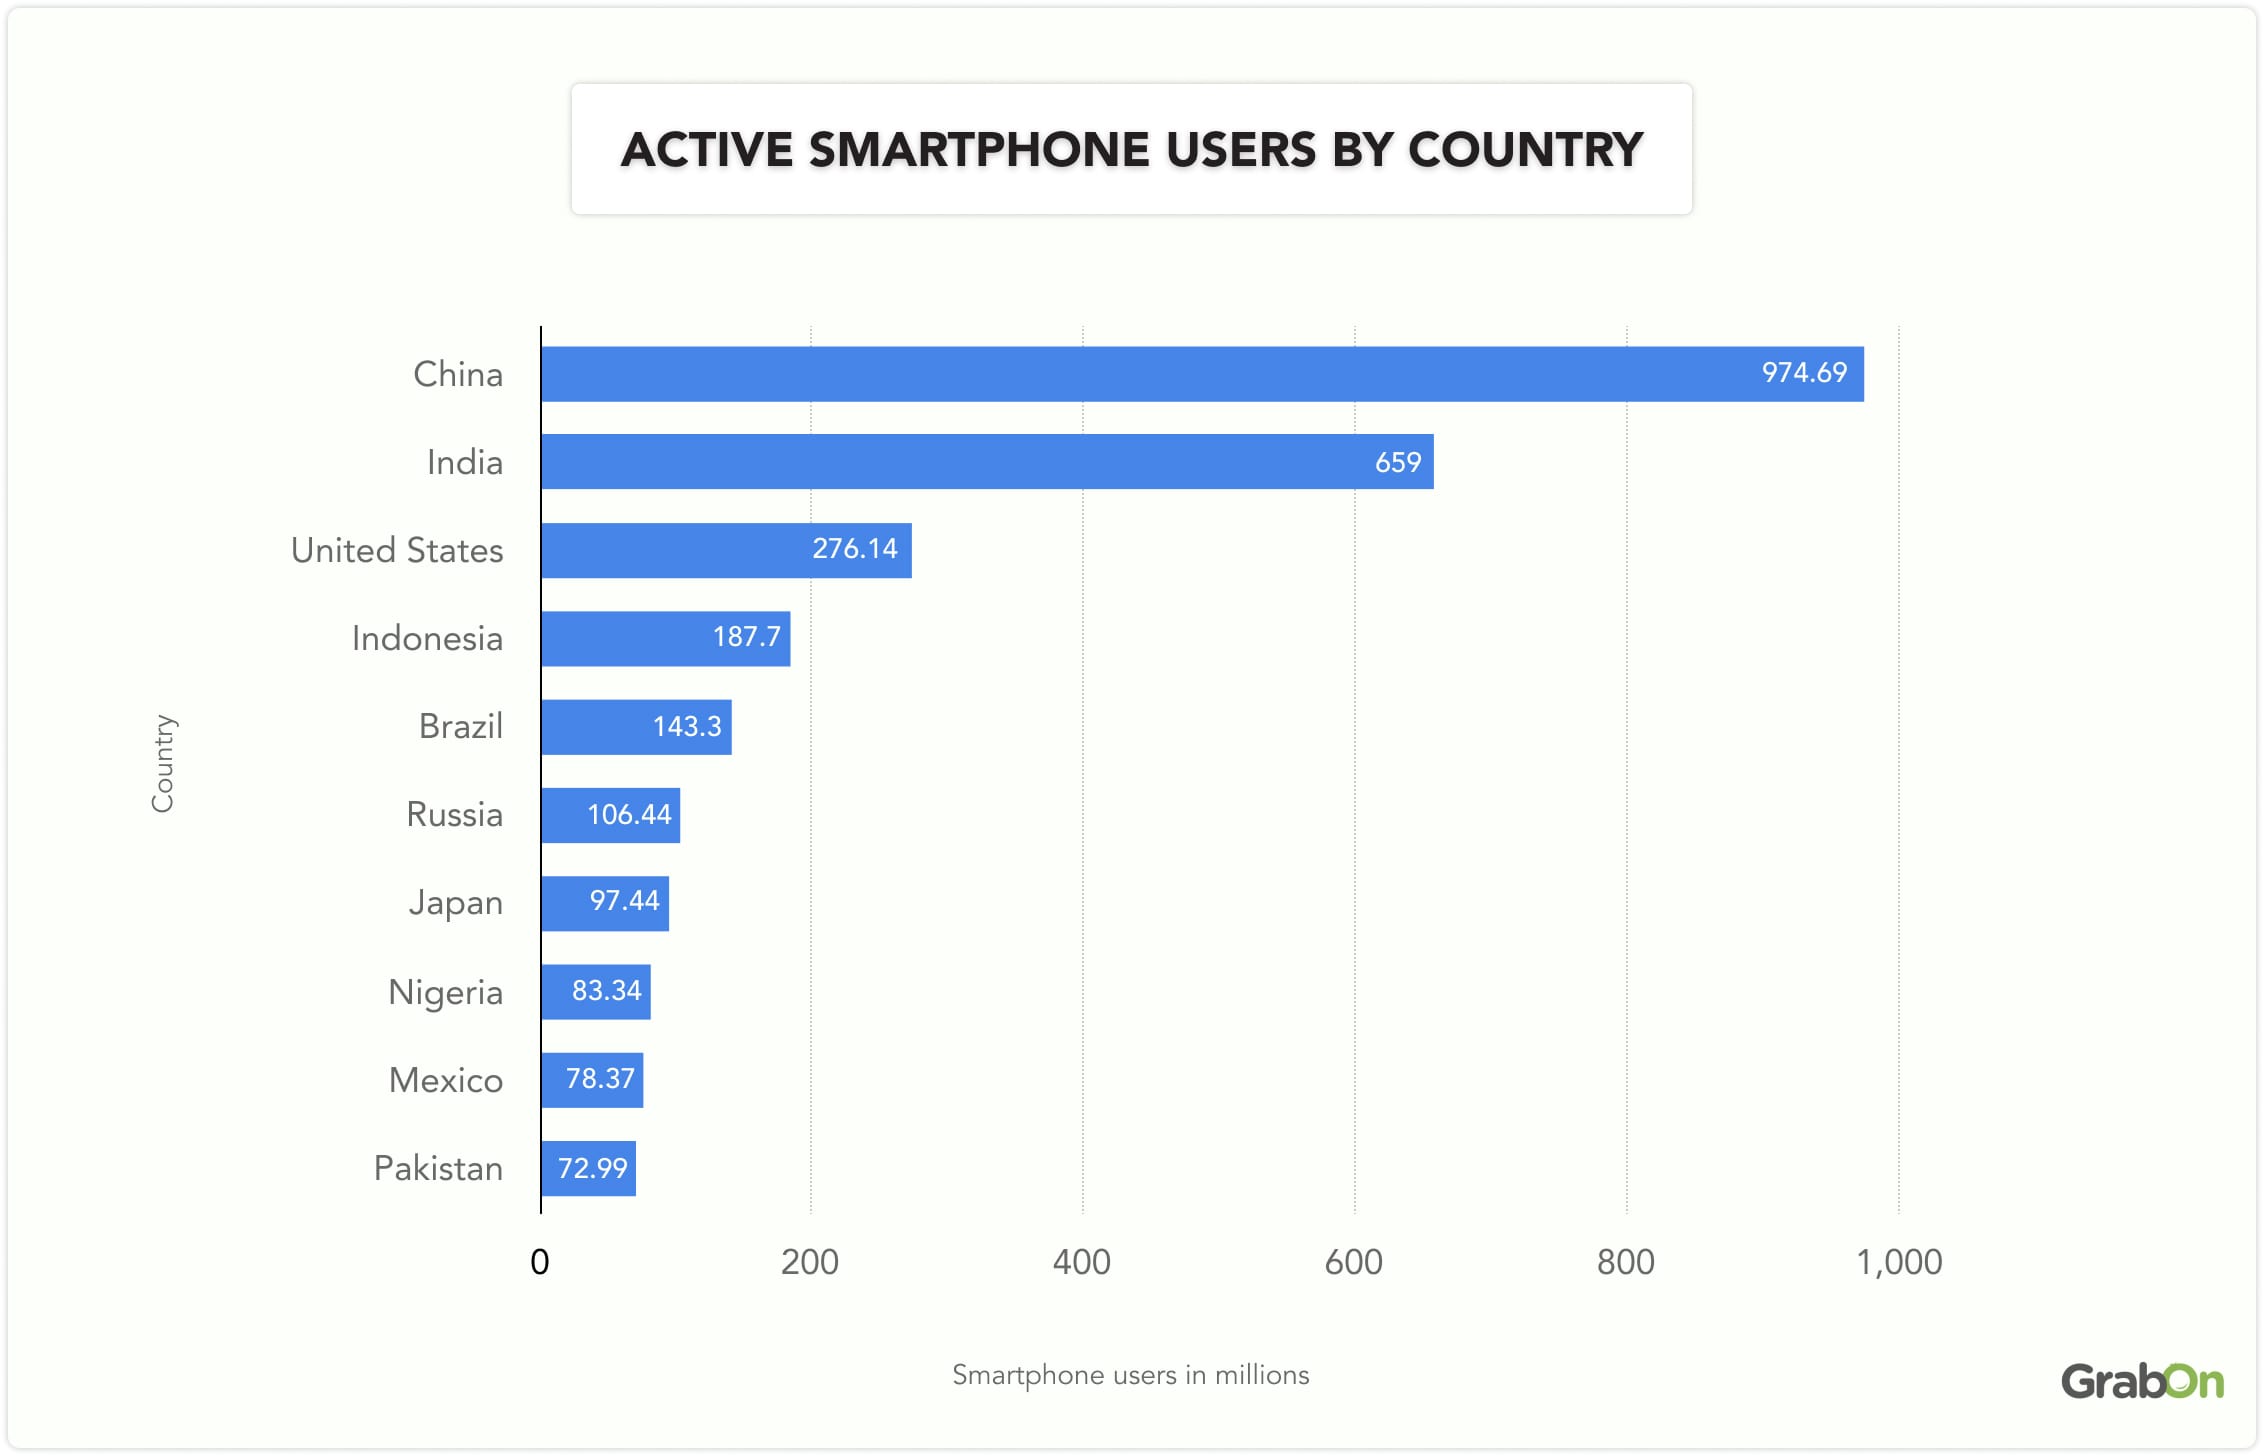
China leads the world with 974.69 million smartphone users and a penetration rate of 68.4%. India, with 659 million smartphone users, shows immense potential for growth given its large population and 46.5% penetration rate, highlighting a growing market. The United States, while having a smaller population, ranks third with 276.14 million users and the highest penetration rate among major countries at 81.6%.
Here is a list of the top ten countries with the highest number of smartphone users, along with insights into the penetration of smartphones relative to their respective populations.
| Country | Total Number of Smartphone Users | Penetration |
| China | 974.69 million | 68.4% |
| India | 659 million | 46.5% |
| United States | 276.14 million | 81.6% |
| Indonesia | 187.7 million | 68.1% |
| Brazil | 143.43 million | 66.6% |
| Russia | 106.44 million | 73.6% |
| Japan | 97.44 million | 78.6% |
| Nigeria | 83.34 million | 38.1% |
| Mexico | 78.37 million | 61.5% |
| Pakistan | 72.99 million | 31% |
Source: Statista
Smartphone Usage By Age
97% of adults aged 18 to 49 own smartphones. As age increases, smartphone ownership decreases, with 89% of adults aged 50-64 and 76% of those aged 65 and older owning smartphones.
The table below highlights how smartphone ownership varies across age groups –
| Age Group | Own a SMARTPHONE | Own a phone, but NOT a smartphone (%) | TOTAL of those who own ANY kind of phone (%) |
| 18-29 | 97% | 1% | 98% |
| 30-49 | 97% | 2% | 99% |
| 50-64 | 89% | 8% | 97% |
| 65+ | 76% | 17% | 93% |
Source: Pew Research
Smartphone Users by Gender
Smartphone ownership is nearly equal between men and women, with 91% of men and 90% of women owning smartphones. The total phone ownership rate, including both smartphones and non-smartphones, is identical at 97% for both genders.
Review the table below for a breakdown of smartphone and overall phone ownership rates between men and women:
| Gender | Own a SMARTPHONE | Own a phone, but NOT a smartphone | TOTAL of those who own ANY kind of phone |
| Men | 91% | 6% | 97% |
| Women | 90% | 7% | 97% |
Source: PewResearch
Smartphone Users by Income
Smartphone ownership rises with income, with 98% of individuals earning $100,000+ owning smartphones compared to 79% in the under $30,000 bracket. The total phone ownership remains high across all income levels, ranging from 94% to 99%.
Refer to the table below for insights into how smartphone and overall phone ownership varies by income range:
| Income Range | Own a SMARTPHONE | Own a phone, but NOT a smartphone | TOTAL of those who own ANY kind of phone |
| Less than $30,000 | 79% | 14% | 94% |
| $30,000 – $69,999 | 90% | 8% | 98% |
| $70,000 – $99,999 | 94% | 3% | 98% |
| $100,000+ | 98% | 1% | 99% |
Source: PewResearch
How Much Time Does the Average Person Spend on Their Phone?
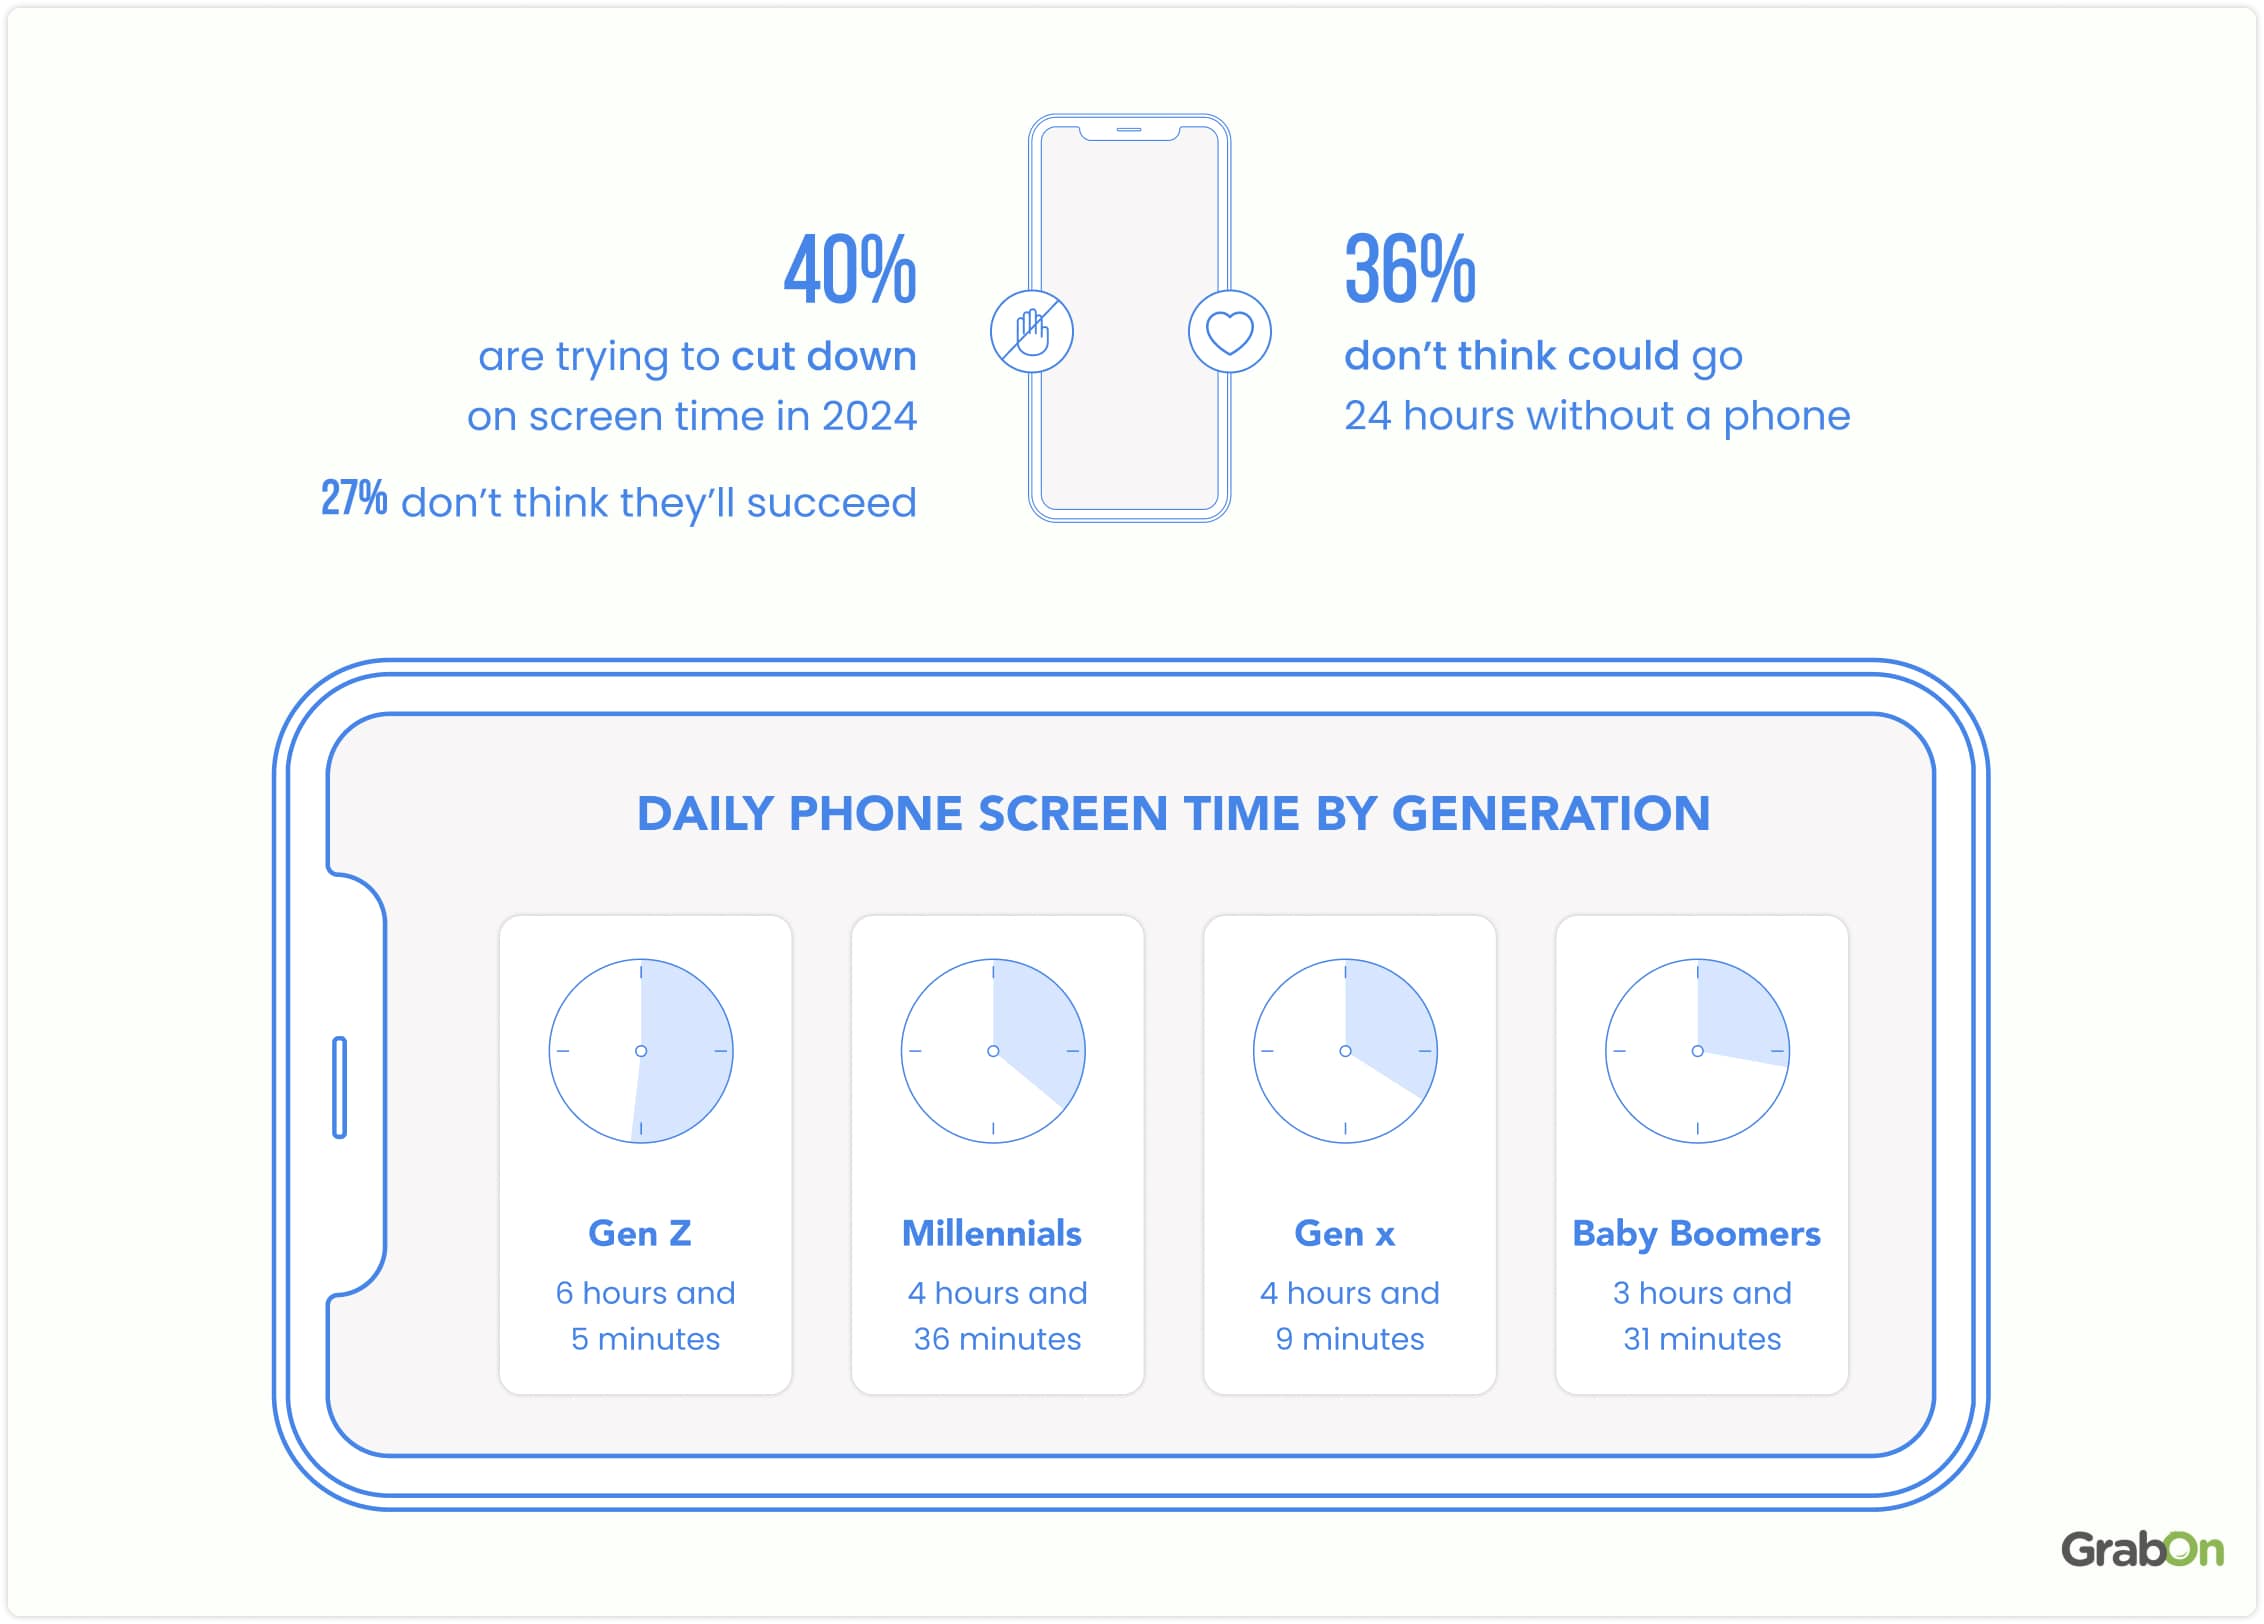
The average person spends 4 hours and 37 minutes on their phone daily. That’s the equivalent of over 1 day per week or 6 days per month. Across a year, that’s approximately 70 days spent looking at a phone.
Source: Harmony Hit
How Often Do People Check Their Phones?
People typically check their phones about 58 times a day, with approximately 52% of these checks occurring during working hours, which amounts to around 30 times.
Regular phone checking can become a habit; statistics show that half of all screen time sessions begin within 3 minutes of the previous session ending.
Here is a breakdown of smartphone usage based on how often people pick up their phones –
| Time Spent on Smartphone | Average Amount of Times Per Day | Percentage of Daily Pick-Ups |
| Less Than 2 Minutes | 40 | 69% |
| 2 to 10 Minutes | 15 | 26% |
| 10+ Minutes | 3 | 5% |
Source: Exploding Topics
Screen Time Trends Across Generations
Approximately 76.3% of Gen Z individuals admit to spending more time on their smartphones daily than they would like. In comparison, about 51.6% of Baby Boomers feel similarly.
Furthermore, 24% of Gen Z respondents reported that excessive smartphone use has become a problem. Additionally, 41% of Gen Zers are actively taking steps to reduce their screen time.
The table below demonstrates how different generations manage their screen time habits –
| Generation | On Phone More Than Preferable | Taking Steps to Reduce Screen Time |
| Baby Boomers | 51.6 | 31.3 |
| Gen X | 66.7 | 40.7 |
| Millennials | 67.3 | 30.5 |
| Gen Z | 76.3 | 41.0 |
Source: Exploding Topics

Source: eMarketer
Smartphone Usage Statistics By Country
People globally spend 4.37 hours on average every day on smartphones.
Indonesia had the highest daily smartphone usage at 6.05 hours, making it the only country in the report with over 6 hours of use. Thailand followed with 5.64 hours, and Argentina with 5.33 hours. In the United States, daily smartphone usage reached 4.43 hours in 2023, slightly up from 4.42 hours in 2022.
Here is a detailed breakdown of smartphone usage time by country:
| Country | Daily Time Spent on Smartphones (2023) |
| Indonesia | 6.05 hours |
| Thailand | 5.64 hours |
| Argentina | 5.33 hours |
| Saudi Arabia | 5.28 hours |
| Brazil | 5.02 hours |
| India | 4.77 hours |
Source: Data.ai
What Are Smartphones Mostly Used For?
Globally, the most popular smartphone activity is messaging, engaged in by 75% of users, followed by emailing at 71% and managing finances at 63%.
Here is a breakdown of the activities users engage in on their smartphones, along with the percentage of users for each activity:
| Activity | Percentage of Users Who Engage |
| Messaging (text/chat) | 75% |
| Emailing | 71% |
| Managing finances | 63% |
| Music streaming | 62% |
| Video streaming | 61% |
Source: Consumer Affairs
Which Apps Do Americans Use the Most?
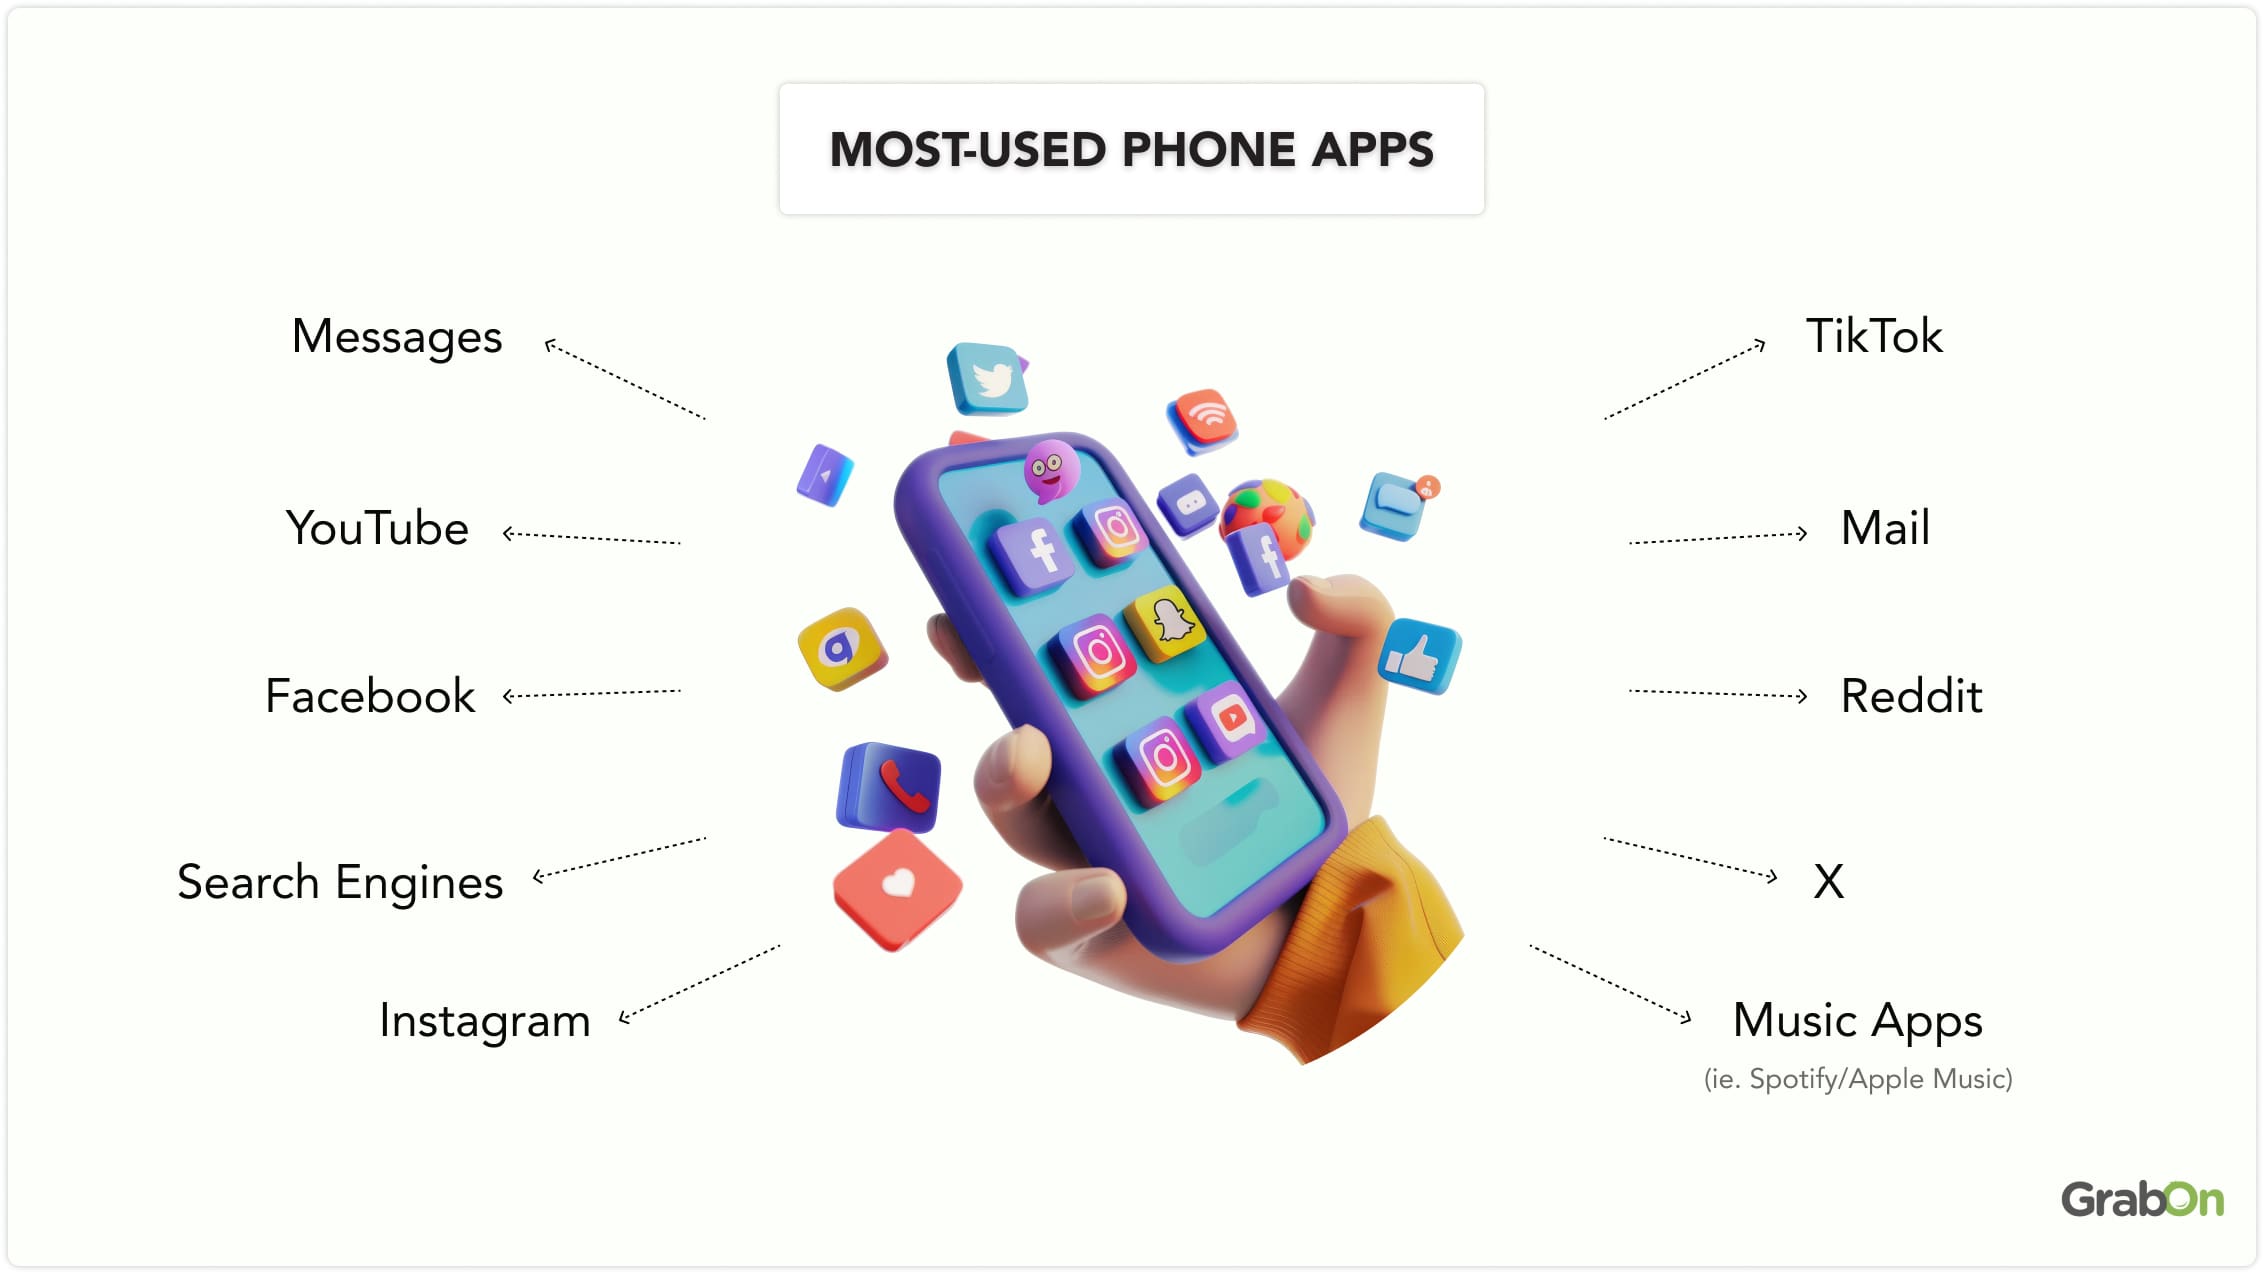
The most frequently used app by Americans on their phones is Messages. Following this, social media dominates, comprising 6 of the 10 most commonly used apps. The rankings are as follows:
- YouTube (2nd)
- Facebook (3rd)
- Instagram (5th)
- TikTok (6th)
- Reddit (8th)
- X (9th)
Gen Z spends the most screen time on TikTok, followed by YouTube. In contrast, other generations primarily use Facebook and YouTube as their top social media apps.
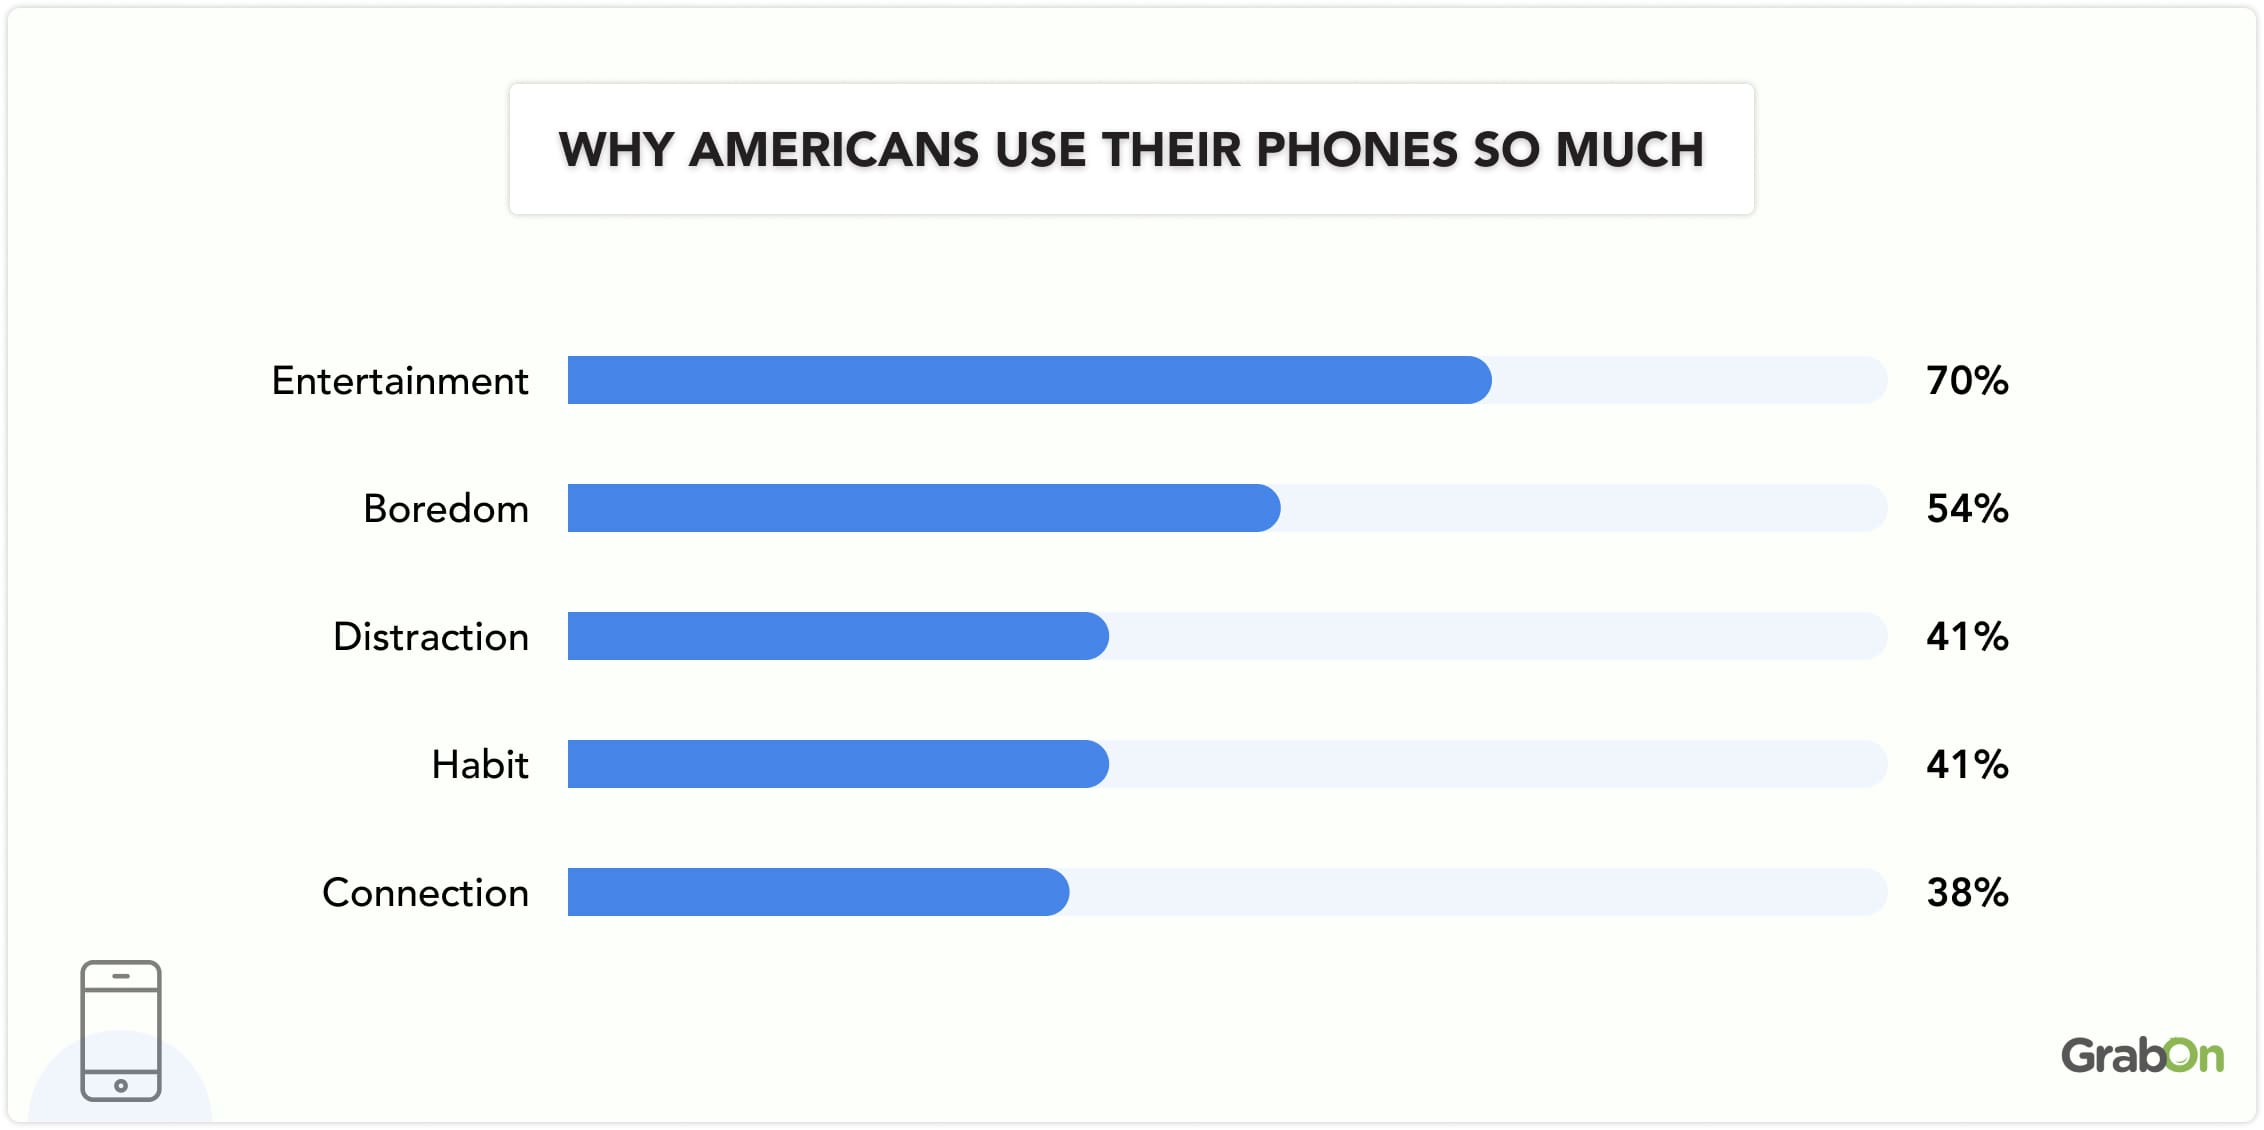
More than 50% of Americans feel they rely too much on their technological devices. 74% feel anxious if they can’t find their phone. 59% use their phones while on the toilet. 27% text while at stoplights. Additionally, 48% have experienced ‘zombie scrolling,’ mindlessly scrolling on their phones without a specific purpose.
Source: Harmony HIT
Smartphone Revenue Statistics
The global smartphone market is expected to reach $0.5 trillion in revenue in 2025. Over the next five years, it is projected to grow steadily at an annual rate (CAGR) of 3.57% from 2025 to 2029. China will lead the way, contributing $105.5 billion to the total revenue.
This growth highlights the continued demand for smartphones, driven by advancements in technology, higher internet penetration, and increasing smartphone adoption across the globe.
For a detailed look at the annual revenue trends, check out the table below:
| Year | Revenue (US $) |
| 2018 | 0.4 trillion |
| 2019 | 0.5 trillion |
| 2020 | 0.4 trillion |
| 2021 | 0.5 trillion |
| 2022 | 0.5 trillion |
| 2023 | 0.5 trillion |
| 2024 | 0.5 trillion |
| 2025 | 0.5 trillion |
| 2026* | 0.5 trillion |
| 2027* | 0.5 trillion |
| 2028* | 0.5 trillion |
| 2029* | 0.6 trillion |
Source: Statista
Smartphone Market Share In The US
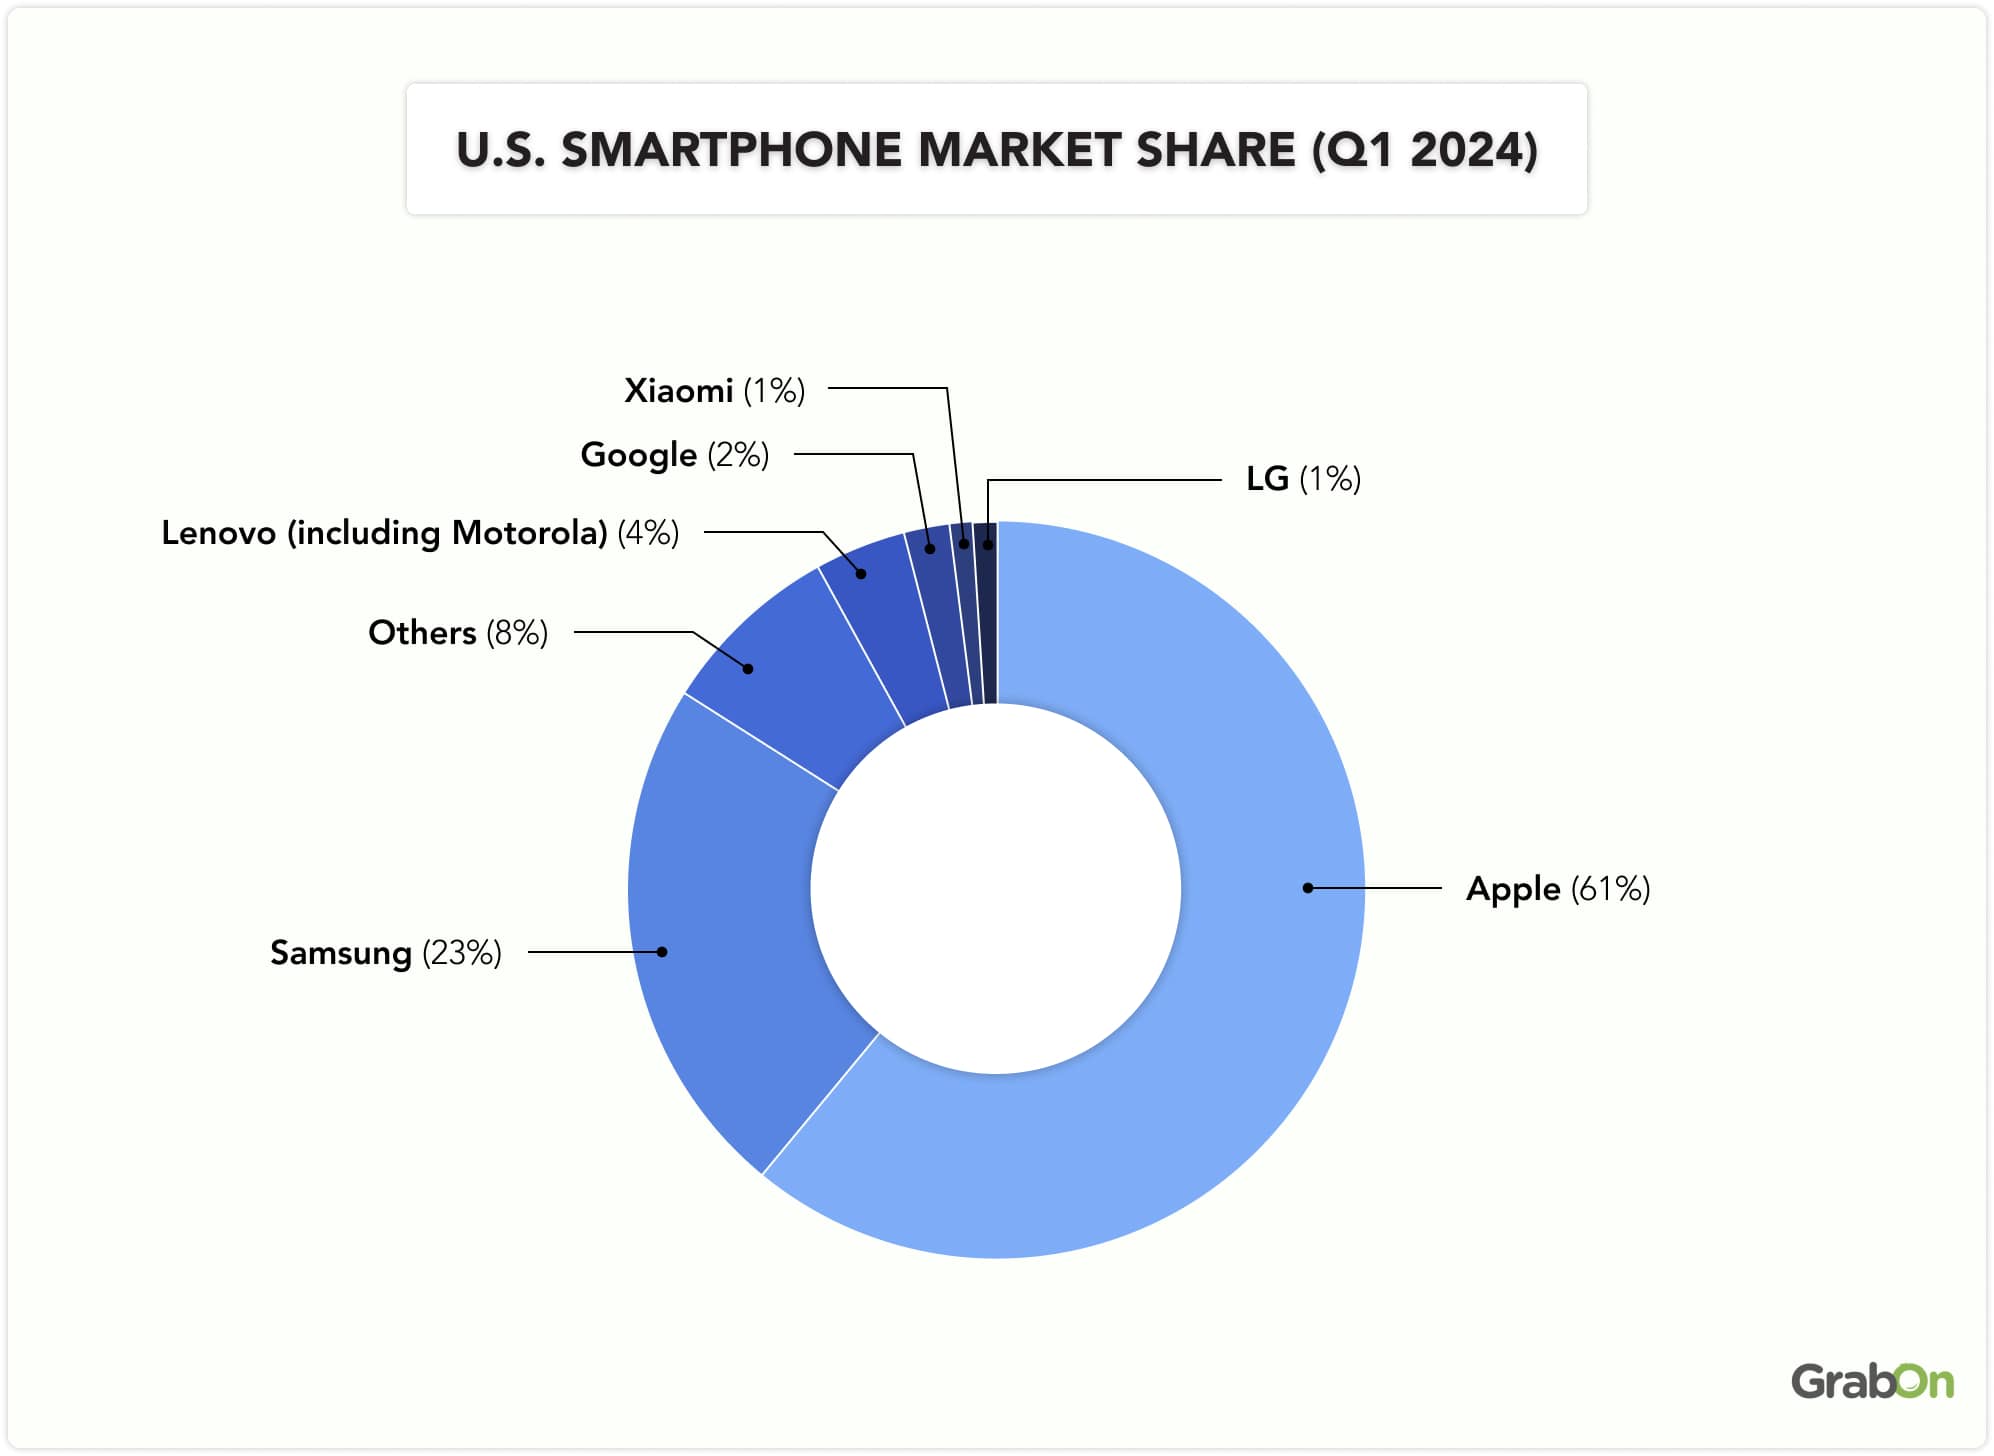
Apple is leading the US smartphone market with a 61.26% share, indicating a high demand for iPhones. Samsung holds the second position with a 22.63% market share, showing a 2.60% decrease from the fourth quarter of 2022.
Together, Apple and Samsung dominate the US smartphone market, accounting for a total of 83.89%, while other brands hold approximately 15% of the market share.
Source: BankMyCell
FAQs
- What percentage of the world uses smartphones?
Approximately 60.42% of the global population uses smartphones, which translates to about 4.88 billion smartphone users worldwide.
- What age uses smartphones the most?
Younger adults aged 18-29 and 30-49 have the highest smartphone ownership rates, with 97% in each group owning smartphones.
- What percent of Americans use phones?
As of 2024, 97% of Americans own a cellphone of some kind, and 90% own a smartphone.
- How many mobile phones are in the world?
As of 2024, there are approximately 8.31 billion mobile phones in use worldwide, including both smartphones and feature phones
Future Trends in Smartphones
Smartphones are expected to see major improvements thanks to on-device AI, 5G connectivity, and AR/VR integration. These advancements will make phones more intuitive and personalized, improving how we communicate, manage tasks, and enjoy multimedia. By 2027, more than 1 billion smartphones with advanced AI capabilities are likely to be shipped globally, marking a significant leap in technology. This transformation will be particularly impactful in emerging markets, where there’s a growing demand for affordable yet powerful smartphones. Overall, these developments will redefine how we use smartphones, making them even more essential in our daily lives.


